NammaMetro: The Conspiracy Theory
Did BMRCL stage a payments disruption to nudge users toward smart cards? A data-driven investigation into the February 2025 fare hike.

NammaMetro Ridership Data Analysis
Last Major Update: 2025-02-28
Author: Mahesh Shantaram <ms@thecontrarian.in>
Table of Contents
1. One Day on NammaMetro
Earliest Record
Latest Record
Day of WeekandTotal RidersMissing Days
The Dataset at a Glance
2. "The Metro is Getting Crowded!"
Top 10 Busiest Days (Commuter Traffic)
Top 10 Least Busy Days (Weekend Traffic)
3. One Week on NammaMetro
Total Ridership over the Last 7 Days
Total Ridership by Day of Week
Average Ridership by Day of Week
Ridership Patterns by Payment Method
4. Three Traffic Bands, Two Kinds of Patrons, One Metro
- Ridership Patterns:
CommutevsCasualrides byTraffic Band
5. One Month on NammaMetro
The Spread of Data
Ebb and Flow of Daily Passenger Traffic
A Wave Rides NammaMetro
6. The Long Weekend and Other Phenomena
Sankranti and Something Else
Ridership Towers – Users and Payments
7. Metro Enables the Visitor Economy
- Come for the sporting and entertainment, stay for the vibes
8. Fare Hike of February 2025 – Impact Analysis
- Did users abandon NammaMetro in the days following the fare hike?
8. The Conspiracy Theory 😈
- Did BMRCL Stage a Payments Disruption to Nudge Users Toward Smart Cards?
One Day on NammaMetro
Let's take a look at source of data that informs the analysis to follow.
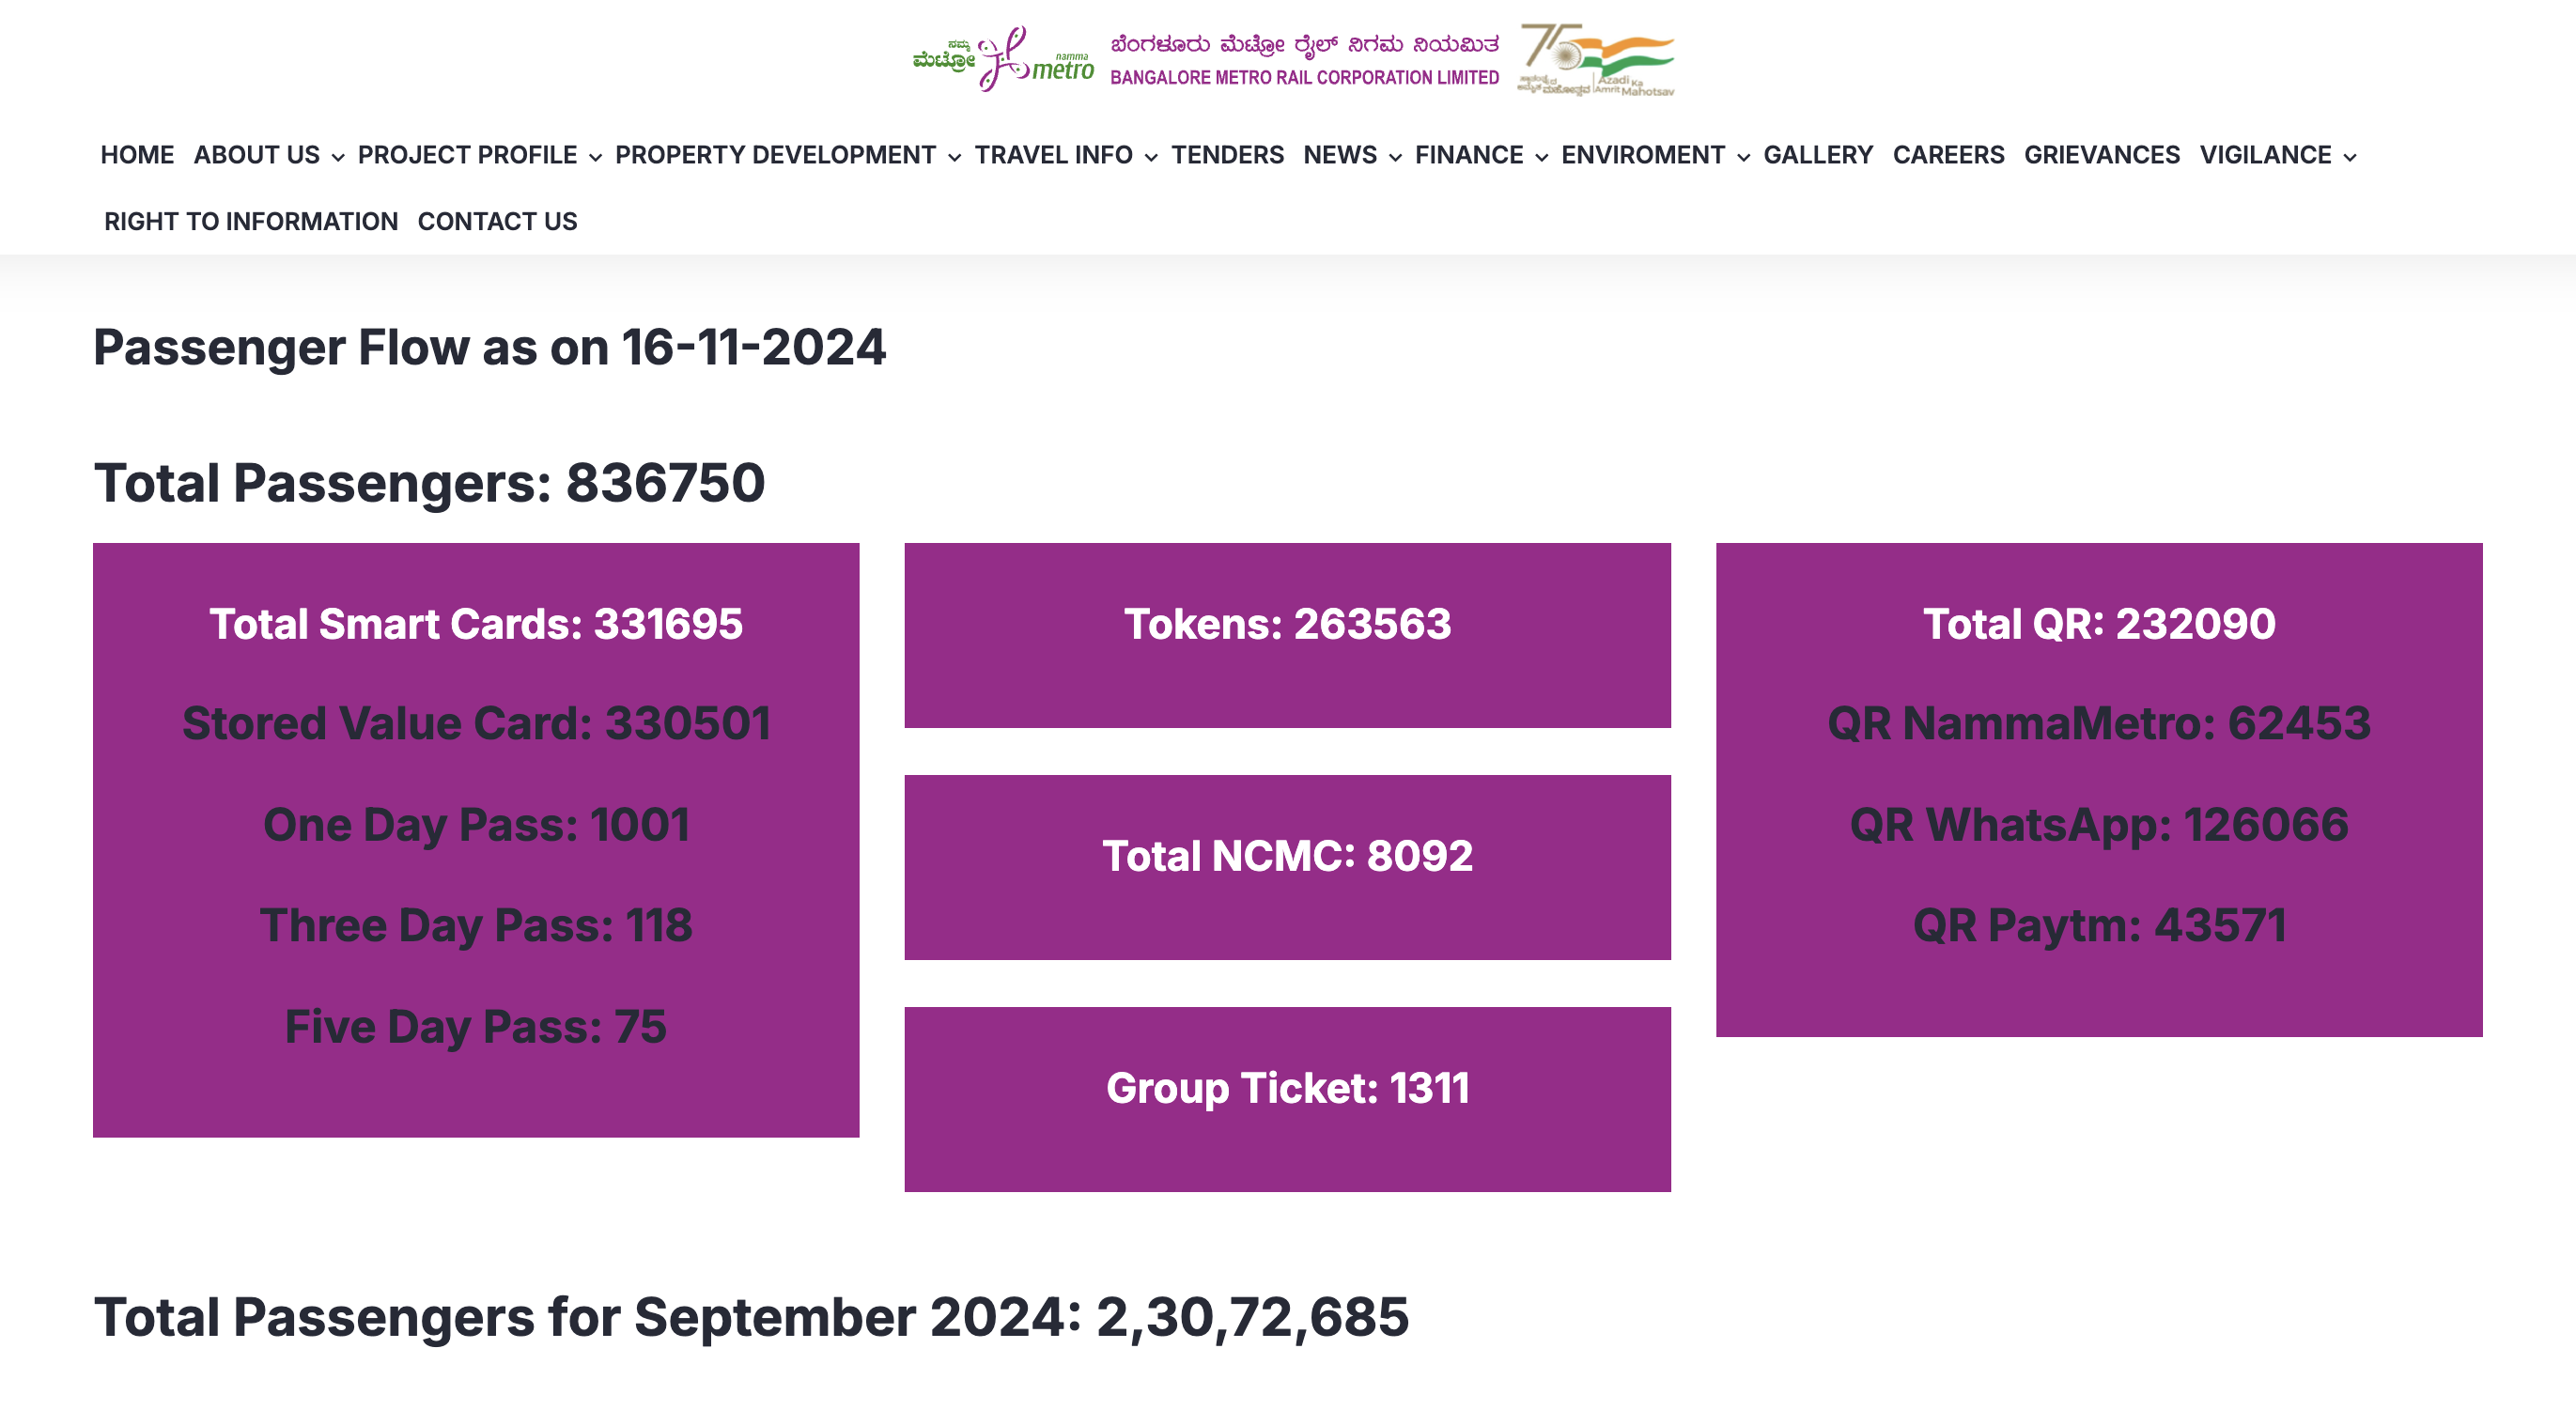
Namma Metro publishes a breakdown of ridership by payment methods used daily by passengers entering the system.
Earliest Record
| Record Date | Total Smart Cards | Stored Value Card | One Day Pass | Three Day Pass | Five Day Pass | Total Tokens | Total NCMC | Group Ticket | Total QR | QR NammaMetro | QR WhatsApp | QR Paytm | |
|---|---|---|---|---|---|---|---|---|---|---|---|---|---|
| 0 | 26-10-2024 | 353460 | 352496 | 853 | 43 | 68 | 241883 | 7444 | 512 | 177279 | 49351 | 95571 | 32357 |
Latest Record
| Record Date | Total Smart Cards | Stored Value Card | One Day Pass | Three Day Pass | Five Day Pass | Total Tokens | Total NCMC | Group Ticket | Total QR | QR NammaMetro | QR WhatsApp | QR Paytm | |
|---|---|---|---|---|---|---|---|---|---|---|---|---|---|
| 149 | 05-05-2025 | 416198 | 415630 | 88 | 32 | 448 | 217786 | 11352 | 138 | 175376 | 50424 | 94205 | 30747 |
Let's create two additional useful features: Day of Week and Total Riders
Missing Days
Every now and then, NammaMetro fails to report ridership numbers.
This usually happens when the individual tasked with manually updating (!!!) the data page goes on leave.
Let's get a better understanding of that missing data.
========================================
Missing Data – Last 10 Dates
========================================
| Record Date | Day of Week | Total Riders | |
|---|---|---|---|
| 168 | 2025-04-12 | Saturday | <NA> |
| 169 | 2025-04-13 | Sunday | <NA> |
| 171 | 2025-04-15 | Tuesday | <NA> |
| 173 | 2025-04-17 | Thursday | <NA> |
| 174 | 2025-04-18 | Friday | <NA> |
| 176 | 2025-04-20 | Sunday | <NA> |
| 177 | 2025-04-21 | Monday | <NA> |
| 180 | 2025-04-24 | Thursday | <NA> |
| 187 | 2025-05-01 | Thursday | <NA> |
| 189 | 2025-05-03 | Saturday | <NA> |
The Dataset at a Glance

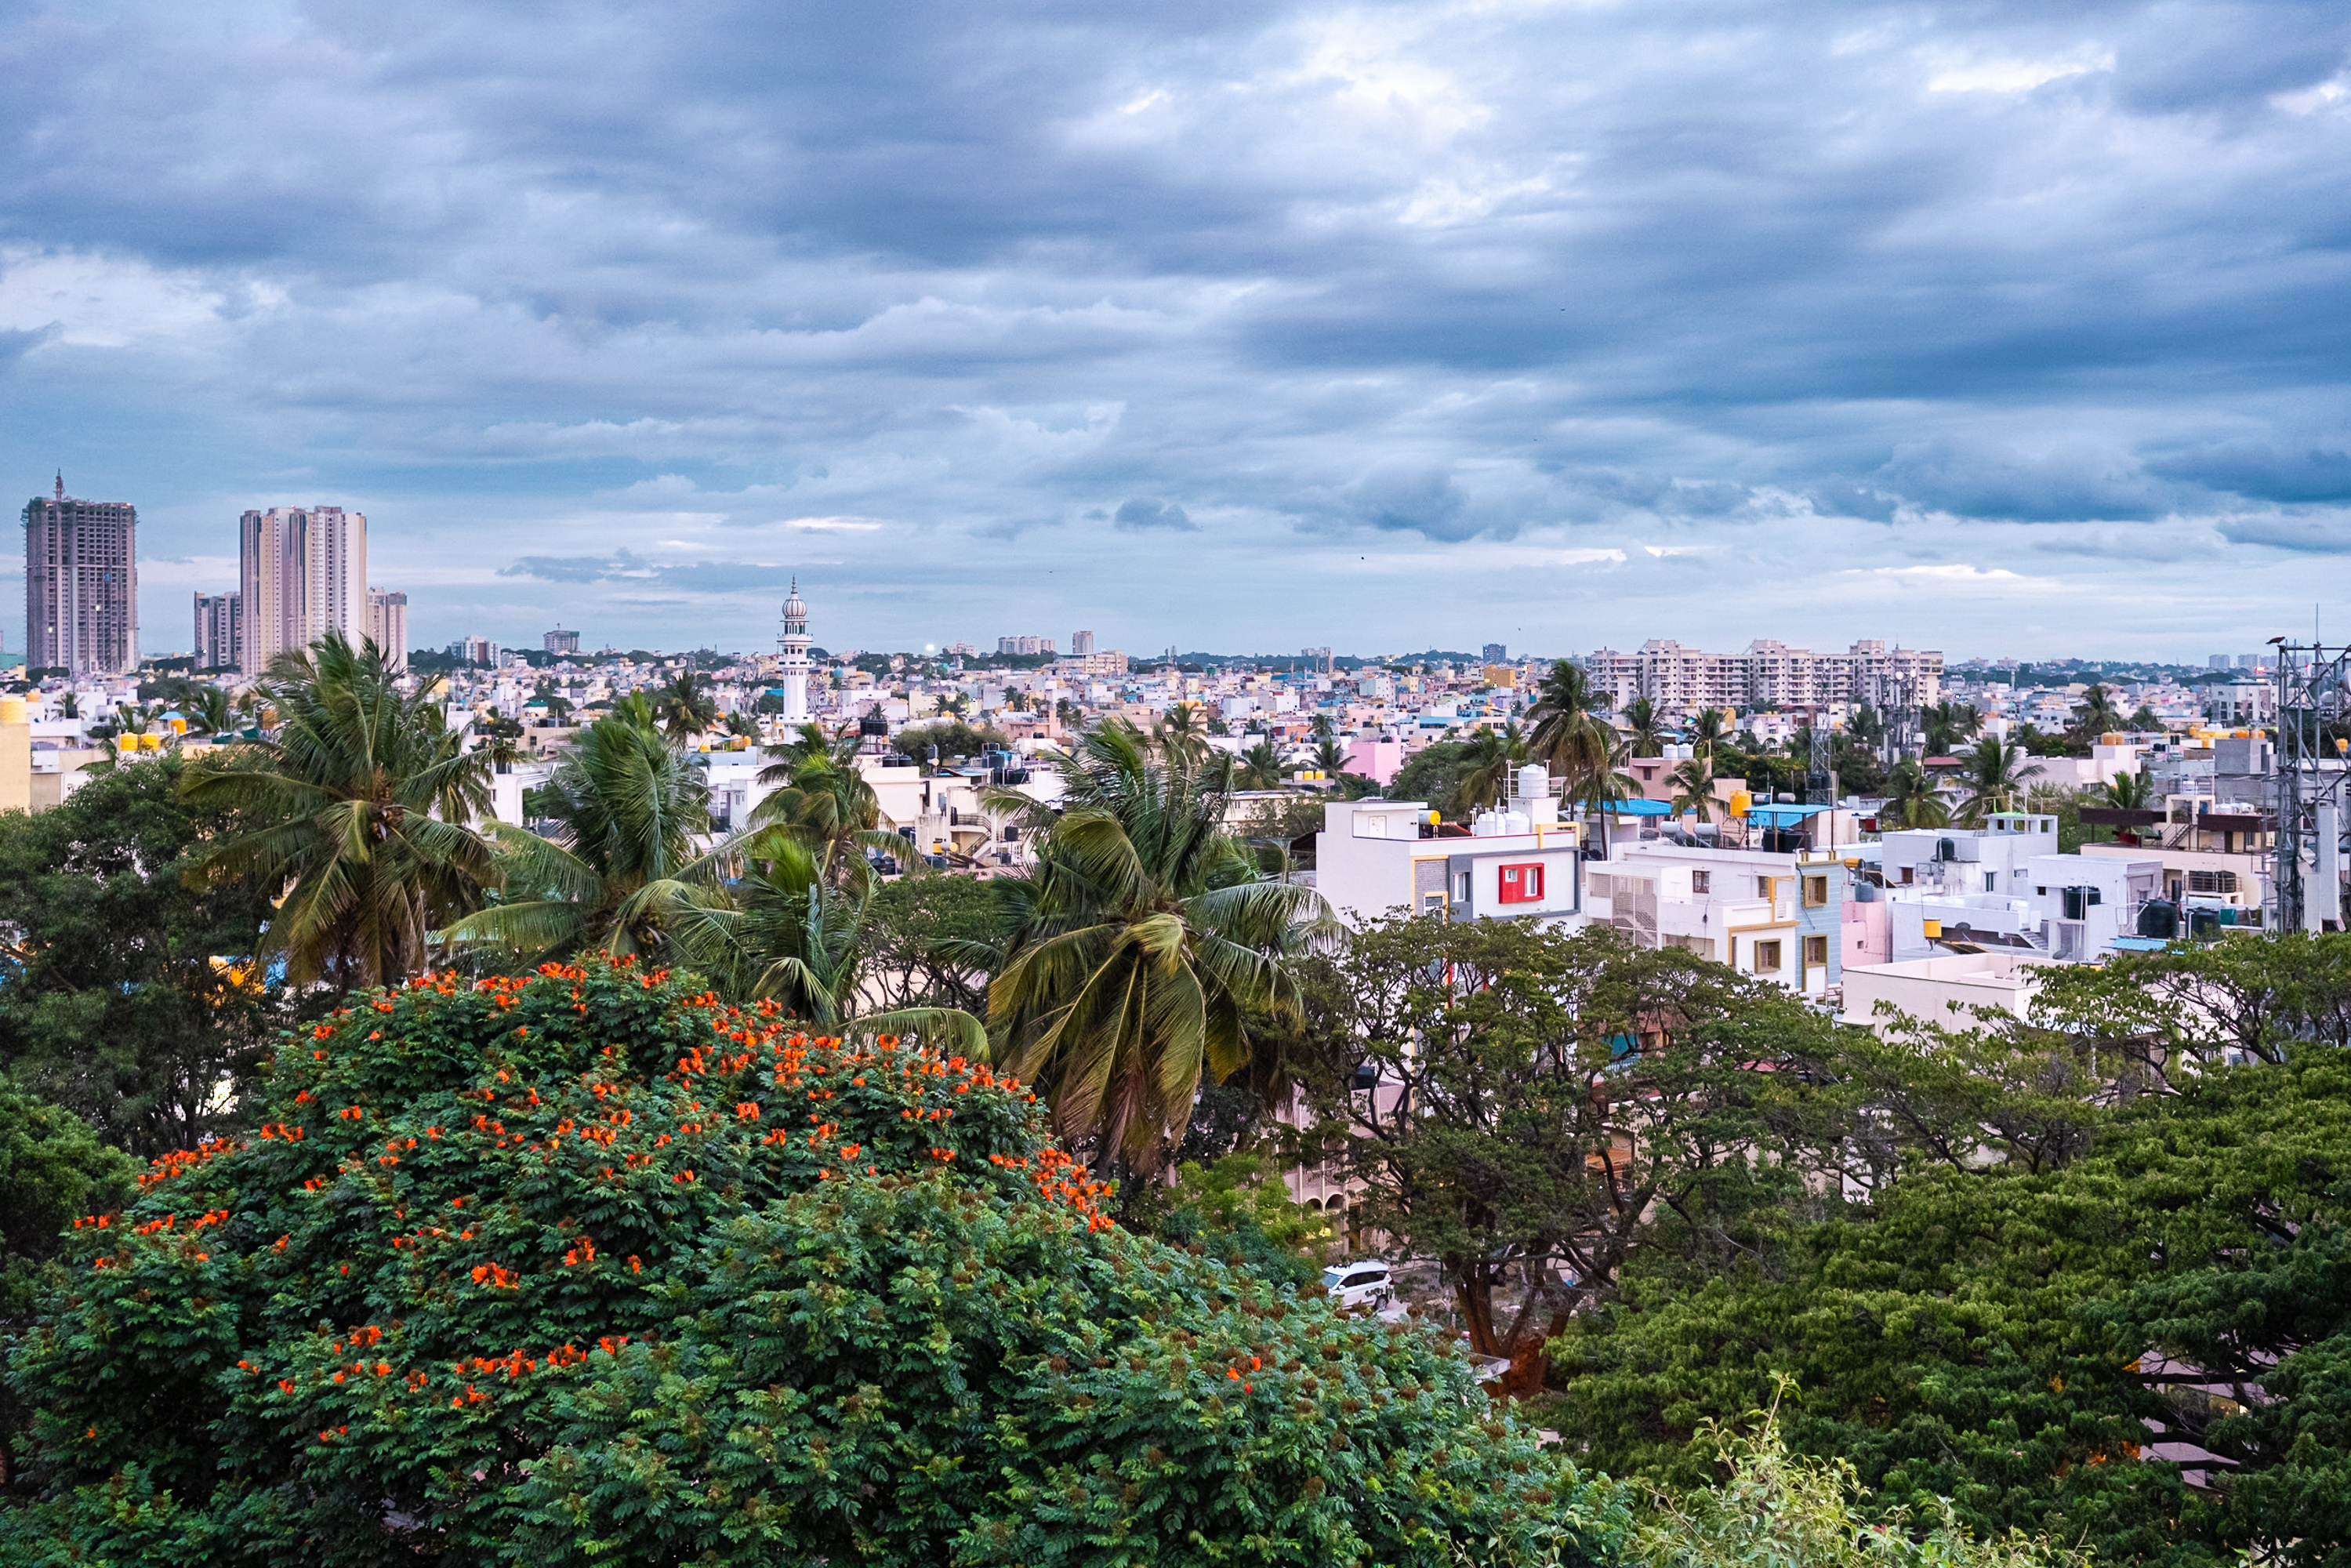
View from
Ⓜ️ Sri Balagangadharanatha Swamiji Station, Hosahalli 🟣 Purple Line
© 2023 Mahesh Shantaram. All Rights Reserved.

Looks like a mouth with a few broken teeth!
What sort of data imputation makes sense here?
When the dataset grows large enough over several months, it makes sense to fill unreported dates with an average of similar days, e.g. If a weekday Tuesday was missing, we would take the average of the last 4-6 available weekday Tuesdays.
“The Metro is Getting Crowded!”
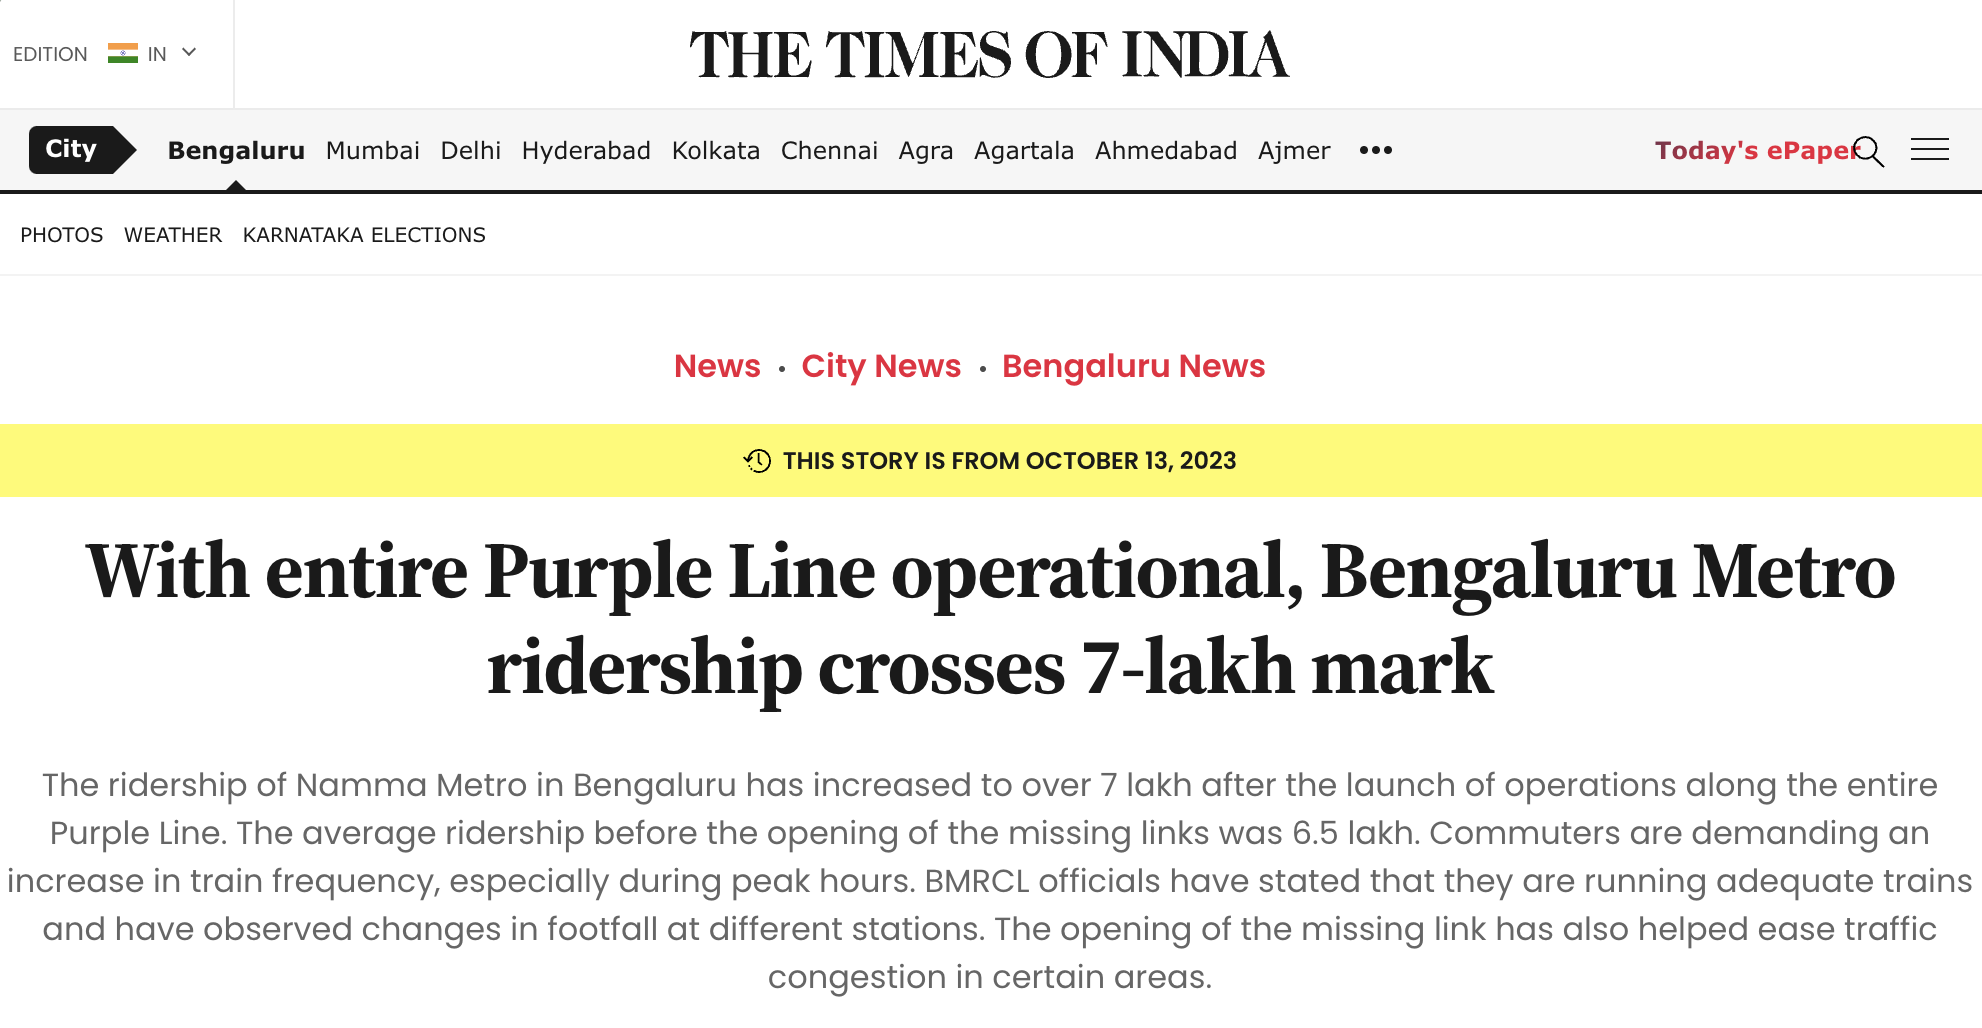
NammaMetro crossed a daily ridership of 700,000 in October 2023
Top 10 Busiest Days - The Commuters
| Record Date | Day of Week | Total Riders | |
|---|---|---|---|
| 1 | 2025-01-27 | Monday | 909522 |
| 2 | 2024-12-10 | Tuesday | 903928 |
| 3 | 2025-01-24 | Friday | 902476 |
| 4 | 2024-12-04 | Wednesday | 901475 |
| 5 | 2024-12-05 | Thursday | 901230 |
| 6 | 2024-12-09 | Monday | 895461 |
| 7 | 2025-01-28 | Tuesday | 891111 |
| 8 | 2024-12-13 | Friday | 890143 |
| 9 | 2024-11-19 | Tuesday | 889113 |
| 10 | 2024-12-07 | Saturday | 883300 |
👆🏼 In December 2024, NammaMetro's single-day ridership crossed 900,000 for the first time!
The ridership hit a record of 700,000 passengers in October 2023. It took just a little over a year to add 200,000 riders/day to the system.
Least Busy Days so far - The Weekenders
| Record Date | Day of Week | Total Riders | |
|---|---|---|---|
| 141 | 2025-04-27 | Sunday | 549663 |
| 142 | 2024-11-03 | Sunday | 536524 |
| 143 | 2025-01-19 | Sunday | 534139 |
| 144 | 2025-02-26 | Wednesday | 520284 |
| 145 | 2025-03-22 | Saturday | 498494 |
| 146 | 2025-01-14 | Tuesday | 484293 |
| 147 | 2024-11-02 | Saturday | 480284 |
| 148 | 2025-03-09 | Sunday | 473005 |
| 149 | 2024-11-01 | Friday | 404342 |
| 150 | 2025-03-30 | Sunday | 402795 |
👆🏼 Sundays, holidays (state and national) and major festivals are when people take a break from the metro.
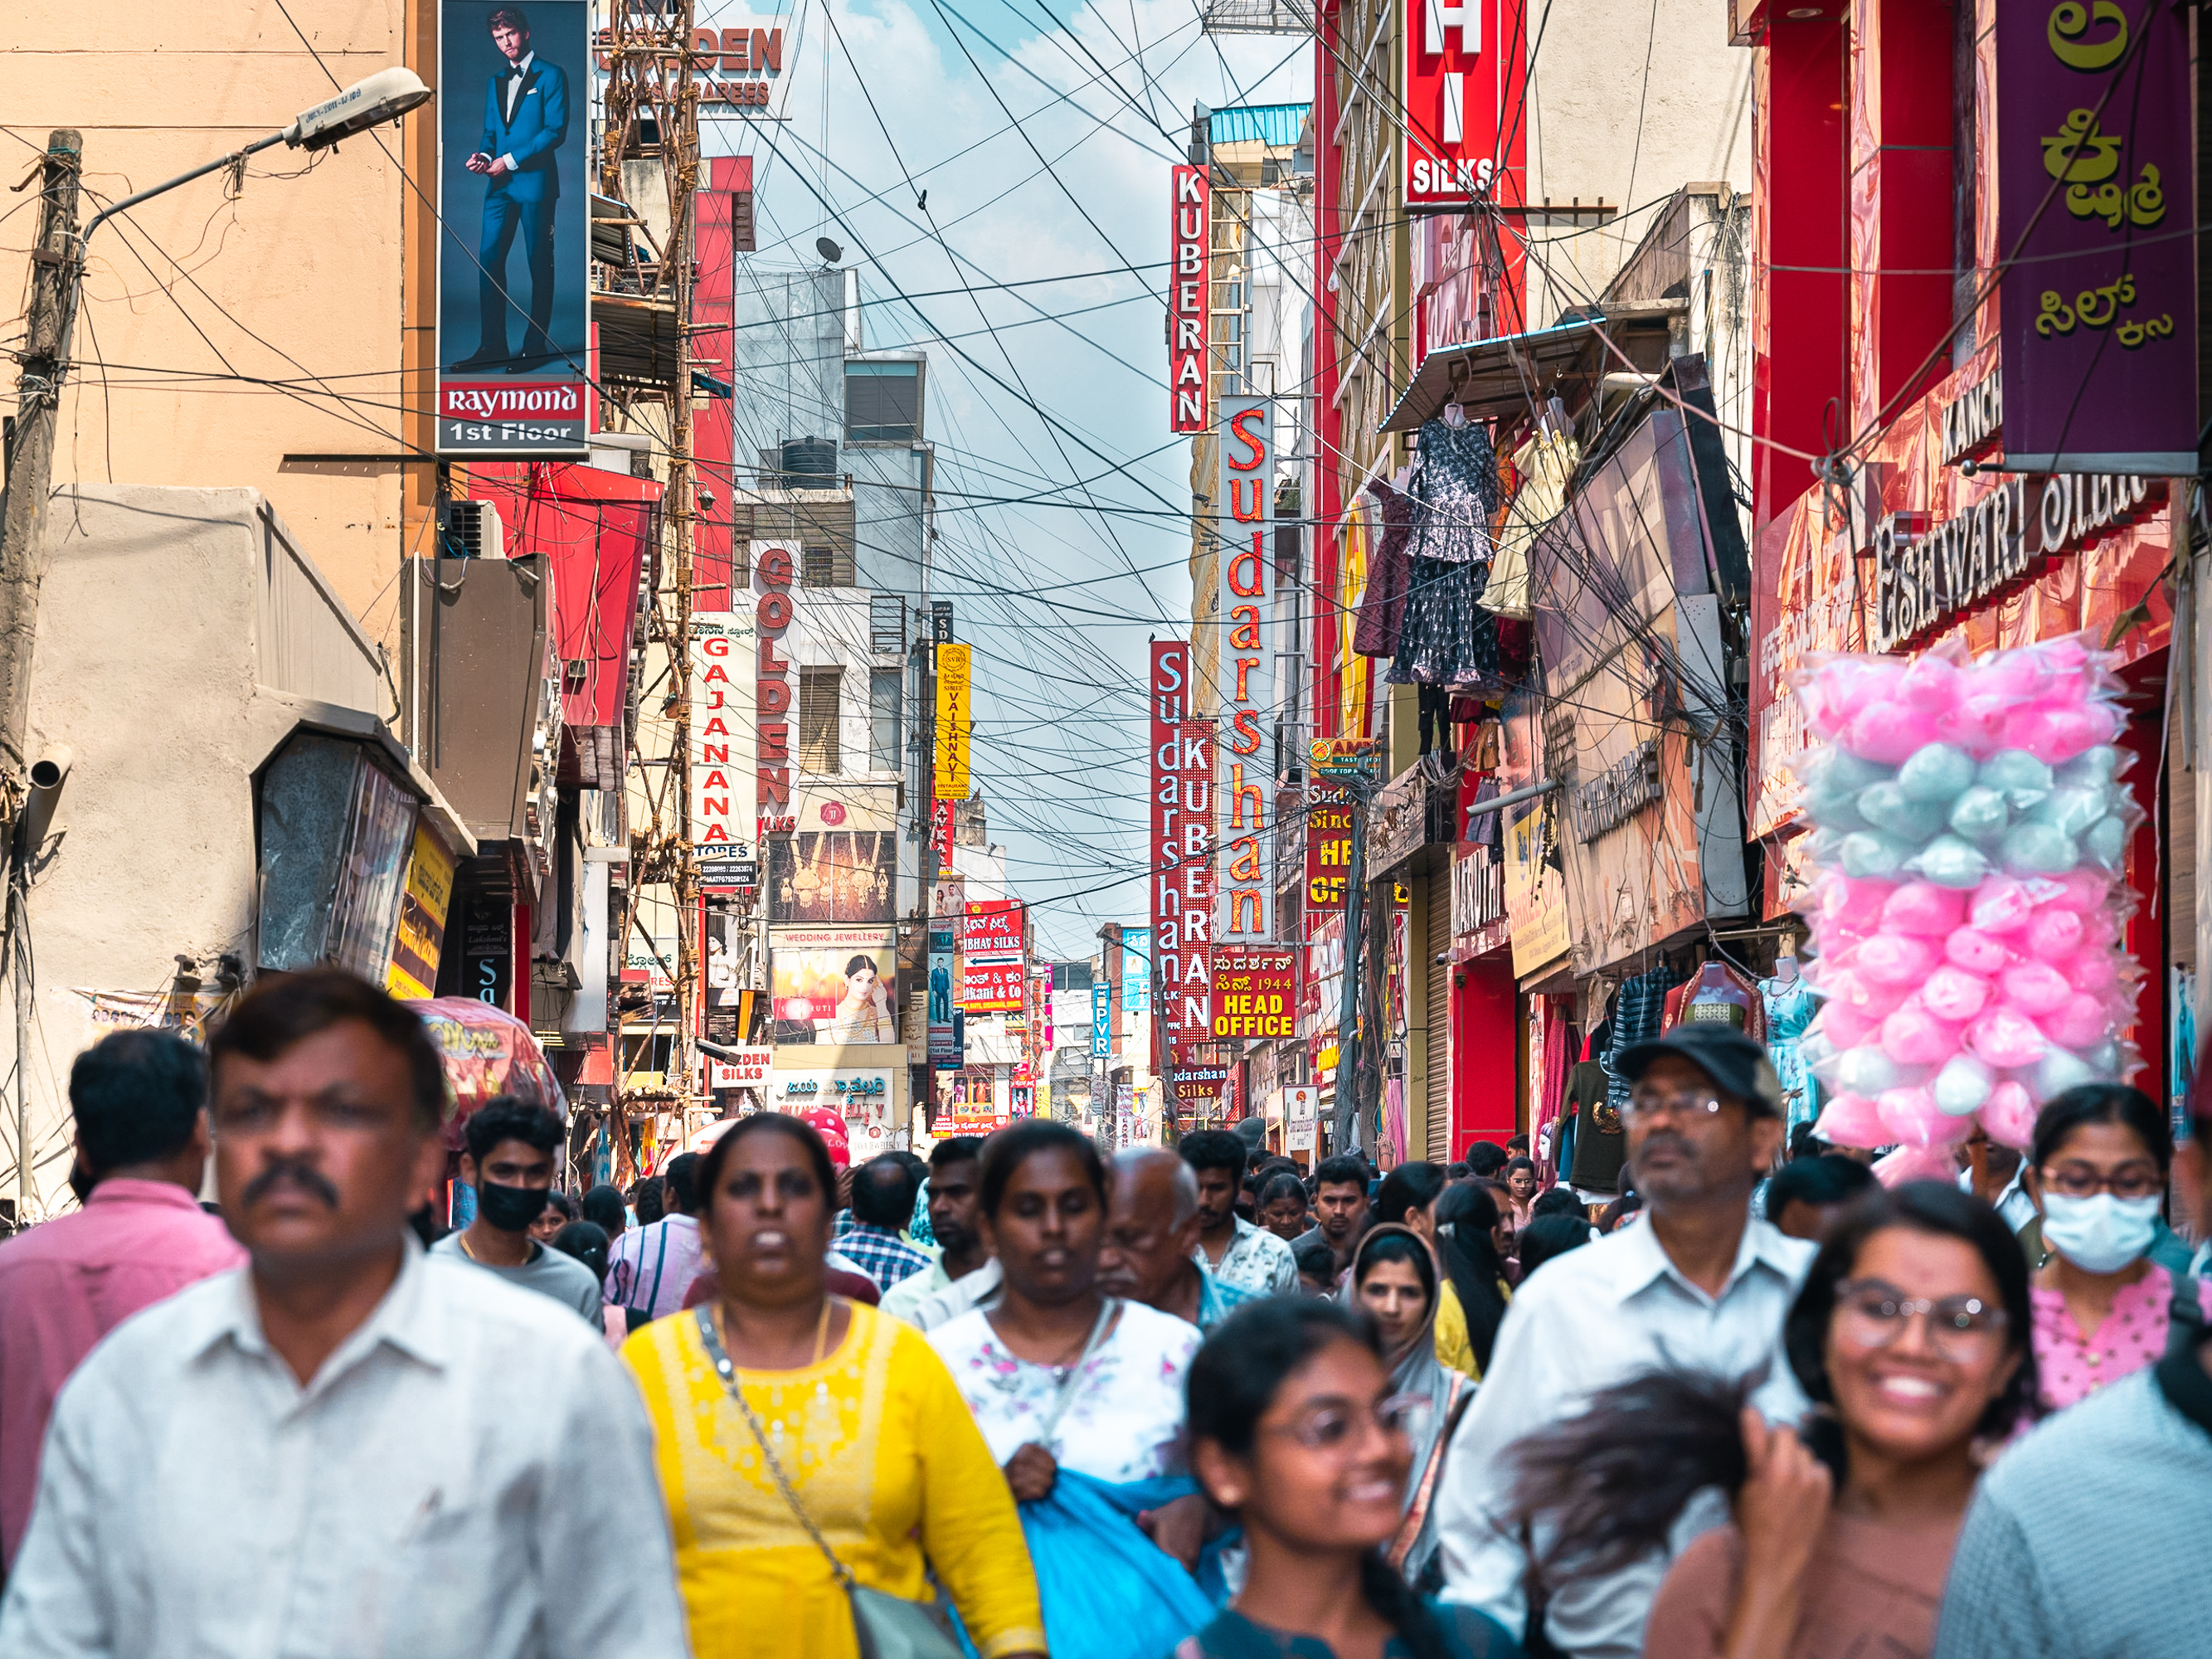
Sunday Shoppers on Avenue Road
Ⓜ️ Chickpete Metro Station 🟢 Green Line
© 2023 Mahesh Shantaram. All Rights Reserved.
One Week on NammaMetro
Total Daily Ridership over the Last 7 days
| Record Date | Day of Week | Total Riders | |
|---|---|---|---|
| 143 | 2025-04-27 | Sunday | 549663 |
| 144 | 2025-04-28 | Monday | 818938 |
| 145 | 2025-04-29 | Tuesday | 841700 |
| 146 | 2025-04-30 | Wednesday | 757335 |
| 147 | 2025-05-02 | Friday | 740148 |
| 148 | 2025-05-04 | Sunday | 567205 |
| 149 | 2025-05-05 | Monday | 820850 |
Total Daily Ridership by Day of Week

This is a series of line plots showing the trend in total ridership for each day of the week over the past several weeks. This makes it easy to spot patterns for specific days and answer several key questions concerning:
consistency ("Are there regular patterns in how ridership fluctuates?")
trends ("Are there seasonal or cyclical patterns in day-specific ridership?")
anomalies ("Which days experienced unusual spikes or dips?")
operational planning ("Are there systematic differences between different days of the week?")
recovery patterns ("Are there lasting impacts from major events?")
Average Daily Ridership by Day of Week
Day of Week
Monday       22
Tuesday      24
Wednesday    22
Thursday     18
Friday       23
Saturday     23
Sunday       18
Name: count, dtype: int64
=============================================
Ridership by Day of Week and Payment Method
Averaged between Nov 9 2024 and Jan 31 2025
=============================================
| Smart Cards | NCMC | Tokens | QR | Group Ticket | Total Riders | |
|---|---|---|---|---|---|---|
| Day of Week | ||||||
| Monday | 441462 | 12493 | 212673 | 191298 | 561 | 858487 |
| Tuesday | 451116 | 13248 | 213403 | 178053 | 555 | 856375 |
| Wednesday | 434914 | 12467 | 210393 | 195043 | 698 | 853515 |
| Thursday | 450936 | 12935 | 201499 | 183966 | 571 | 849907 |
| Friday | 426963 | 12319 | 208535 | 184141 | 632 | 832590 |
| Saturday | 338942 | 8019 | 235329 | 213908 | 788 | 796986 |
| Sunday | 178857 | 4883 | 249868 | 204008 | 687 | 638303 |
weekly_average summarizes three months of metro ridership data showing the typical number of passengers using each payment method on different days of the week. It eliminates dates that display anomalous behaviour so that the result is more representative of an average week. This table forms the foundation for our analysis of commuter patterns and weekend behavior ahead in the analysis.
Average Daily Ridership by Payment Method

👆🏼 Surprising find: Smart Card and NCMC usage peaks during the week; Tokens and QR peaks on weekends.
From Monday to Thursday, Smart Card and NCMC usage – typically used by regular metro riders commuting to work – averages 450,000 and 12,000 respectively.
Tokens and QR payments, typically used by non-regular metro riders, reach peak usage on Sundays. This suggests weekend and holiday demand is driven by casual users, e.g. road users who switch to public transport on the weekends.
Commuters: Officegoers who are committed to using public transport. We assume they use stored deposit value digital payment methods like Smart Cards and NCMC for efficiency.
Casual Users: People who use public transport to run errands, get around on the weekends, etc. Typically, they use Tokens, QR, and Group Tickets to access the system.
Looking at usage patterns by days of the week, there appears to be three distinct traffic bands in Bangalore City:
Weekdays: Without doubt, Mondays through Thursdays see heavy ridership as the metro ferries people to work and back
Weekend: Total ridership on Sundays dips to 50% of the average Weekday.
Weekend Lite: Friday begins to exhibit weekend-like behaviour. But then, Saturday is a full working day for many in this city.
Three Traffic Bands, Two Kinds of Patrons, One Metro
Ridership Patterns: Commute vs Casual rides by Traffic Band
Given what we have learned so far, let us introduce new data features into our dataframe:
Commute: Sum of Smart Cards and NCMC users, representing regular travelers who prefer reusable payment methodsCasual: Sum of Tokens, QR tickets, and Group tickets, representing occasional travelers who opt for single-journey payment methodsTraffic Band: Weekday (Mon-Thu), Weekend Lite (Fri-Sat) or Weekend (Sun)
| Record Date | Day of Week | Traffic Band | Smart Cards | NCMC | Commute | Tokens | QR | Group Ticket | Casual | Total | |
|---|---|---|---|---|---|---|---|---|---|---|---|
| 0 | 2024-10-26 | Saturday | Weekend Lite | 353460 | 7444 | 360904 | 241883 | 177279 | 512 | 419674 | 780578 |
| 1 | 2024-10-27 | Sunday | Weekend | 176278 | 4278 | 180556 | 250124 | 205910 | 458 | 456492 | 637048 |
| 2 | 2024-10-28 | Monday | Weekday | 452257 | 11076 | 463333 | 208014 | 177629 | 160 | 385803 | 849136 |
| 3 | 2024-10-29 | Tuesday | Weekday | 452299 | 10948 | 463247 | 205421 | 182210 | 407 | 388038 | 851285 |
| 4 | 2024-10-30 | Wednesday | Weekday | 425759 | 9975 | 435734 | 233366 | 201583 | 198 | 435147 | 870881 |
| ... | ... | ... | ... | ... | ... | ... | ... | ... | ... | ... | ... |
| 145 | 2025-04-29 | Tuesday | Weekday | 440446 | 11539 | 451985 | 212405 | 177165 | 145 | 389715 | 841700 |
| 146 | 2025-04-30 | Wednesday | Weekday | 343578 | 9302 | 352880 | 222973 | 181382 | 100 | 404455 | 757335 |
| 147 | 2025-05-02 | Friday | Weekend Lite | 349778 | 9009 | 358787 | 217440 | 163742 | 179 | 381361 | 740148 |
| 148 | 2025-05-04 | Sunday | Weekend | 135141 | 4138 | 139279 | 249681 | 178146 | 99 | 427926 | 567205 |
| 149 | 2025-05-05 | Monday | Weekday | 416198 | 11352 | 427550 | 217786 | 175376 | 138 | 393300 | 820850 |
150 rows × 11 columns
The Weekend Lite Crossover Phenomenon
| Day of Week | Traffic Band | Commute | Casual | Total |
|---|---|---|---|---|
| Monday | Weekday | 453,955 | 404,532 | 858,487 |
| Tuesday | Weekday | 464,364 | 392,011 | 856,375 |
| Wednesday | Weekday | 447,381 | 406,134 | 853,515 |
| Thursday | Weekday | 463,871 | 386,036 | 849,907 |
| Friday | Weekend Lite | 439,282 | 393,308 | 832,590 |
| Saturday | Weekend Lite | 346,961 | 450,025 | 796,986 |
| Sunday | Weekend | 183,740 | 454,563 | 638,303 |

💡 Two Kinds of Patrons
Ridership starts to dip on Fridays (perhaps due to liberal work-from-office policies in the IT industry or commuters preferring to use their personal vehicles.) For another segment of workers, Saturdays are as much a working day as the rest of the week.
On Sundays, Smart Cards+NCMC usage sees a ~60% drop from average Weekday levels. Tokens+QR increases by ~15%.
This behaviour confirms the presence of two distinct types of users: Commuters and Casual Users.
NammaMetro thus exhibits a dual role: a commuter necessity on weekdays and a convenient transport option on weekends and holidays
💡 Three Traffic Bands
💼 Weekdays – Just Another Manic Monday to Thursday
- This visualisation validates our hypothesis about Bangalore's distinct traffic bands and rider categories. During weekdays, defined as Monday to Thursday, commuter ridership dominates, showing a consistent pattern that reflects the city's work rhythm. These commuters rely on Smart Cards and NCMC to quickly move in and out of the NammaMetro system.
🍻 Weekend Lite – Should I Stay or Should I Go?
- A remarkable crossover occurs in this band. Friday marks a clear shift where casual ridership begins to rise while commuter numbers decline. This pattern becomes even more pronounced on Saturday, where casual users nearly match commuter levels, suggesting a transformation in how the metro serves the city's needs – from a commuting utility to a general transportation option.
🛌🏼 Weekend – A Day of Rest For Coders (But Not QR Coders)
- The starkest contrast appears on Sundays, where the two rider categories tell very different stories. Commuter numbers plummet to their lowest point while casual ridership reaches peak levels. This dramatic reversal reveals how the metro adapts to serve leisure travelers and weekend activities even as regular commuters largely stay home.
This pattern not only confirms our three-band traffic model but also reveals how different segments of Bangalore's population use the metro system throughout the week, shifting from a commuter-dominated service to one that primarily serves casual travellers during weekends.
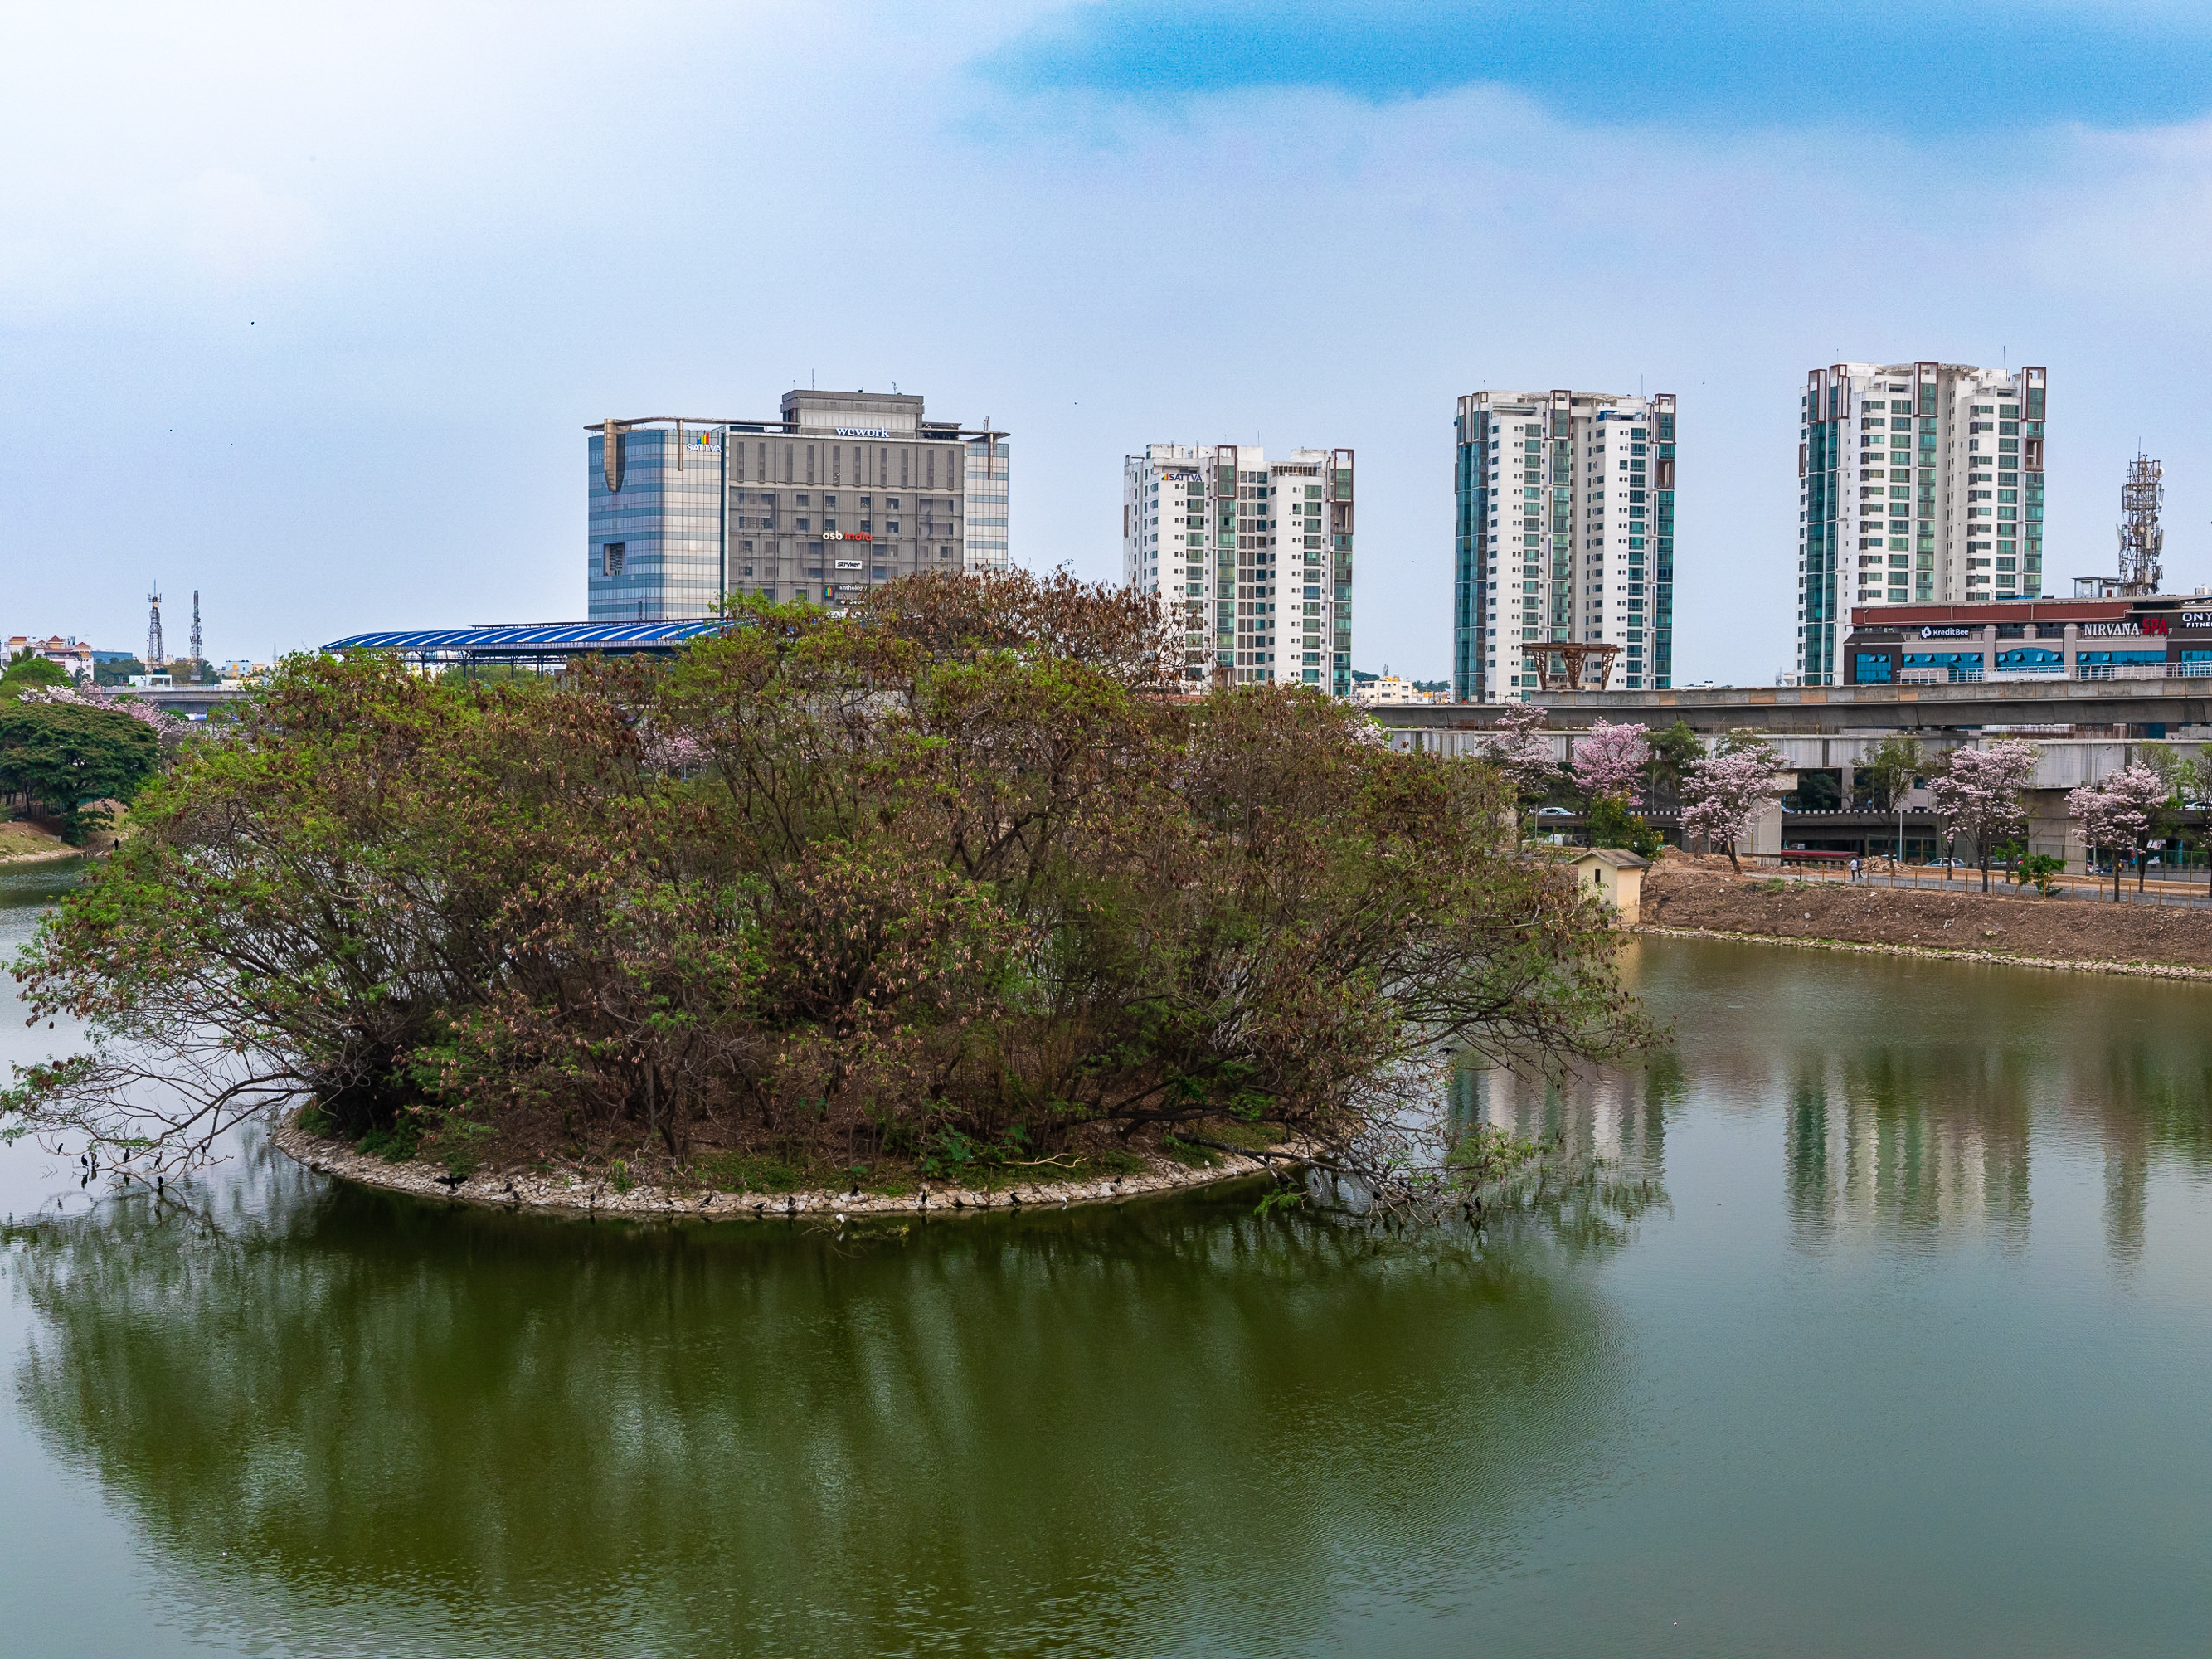
Benniganahalli Lake at Tin Factory Junction
Ⓜ️ Benniganahalli 🟣 Purple Line
© 2023 Mahesh Shantaram. All Rights Reserved.
One Month on NammaMetro
Remember that NammaMetro fails to report ridership numbers on some days, so the monthly ridership totals calculated from the data is going to be only an approximate. However, we can still identify trends and patterns by analysing data movement on a granular level.
Here are the official monthly ridership stats as reported by BMRCL:
| Month | Ridership |
|---|---|
| 2024 July | 23,633,166 |
| 2024 August | Unavailable |
| 2024 September | 23,072,685 |
| 2024 October | Unavailable |
| 2024 November | 23,613,895 |
| 2024 December | 24,982,906 |
| 2025 January | 24,914,736 |
Let us try to construct the monthly ridership numbers from the available data.
===================================
Total Rides Served per Month ⁺
===================================
| Year-Month | Monthly Total (millions) | Daily Average (thousands) | |
|---|---|---|---|
| 0 | 2024-11 | 19.717 | 788.697 |
| 1 | 2024-12 | 22.363 | 798.696 |
| 2 | 2025-01 | 20.231 | 809.229 |
| 3 | 2025-02 | 19.146 | 765.830 |
| 4 | 2025-03 | 16.526 | 718.505 |
| 5 | 2025-04 | 12.379 | 773.703 |
⁺ Estimate based on available data as on 2025-05-05
  plus extrapolation based on day averages.
✨ The reported vs. estimated ridership numbers align closely, validating the accuracy of our extrapolations.
The Spread of Data

📘 Notes
Statistical summary of data spread:
The boxplot clearly shows the median (middle line), interquartile range (box height), outliers (circles with dates, if that helps), and means (diamonds) for each month.
February 2025 has a narrower box than December 2024, suggesting more consistent day-to-day ridership despite lower overall numbers.
Ebb and Flow of Daily Passenger Traffic
Visually examine the flow of total passenger traffic during the last several days, weeks and months.

📘 Notes
Weekly Pattern: The plot reveals strong weekly cycles. Each weekend dip is followed by a sharp recovery, demonstrating the metro's vital role in weekday commuting.
Trend Significance: While the trend line suggests a slight increase in ridership, this pattern is too weak for meaningful forecasting.
Further Analysis: The high variability in aggregate data suggests we should segment our analysis. This may reveal patterns that are currently masked by day-to-day fluctuations.
When and How: These two plots taken together tell a more complete story - the area chart shows "when" patterns occur while the boxplot shows "how distributed" the data is within each month.
📘 R² Interpretation Scale – Ranging from 0.0 to 1.0, R² is a measure of how well the regression line explains variability in ridership data.
| R² Range | Interpretation | Use Case |
|---|---|---|
| > 0.75 | Very Strong | Highly reliable for forecasting |
| 0.50 - 0.75 | Strong | Good for general predictions |
| 0.25 - 0.50 | Moderate | Use with caution |
| 0.10 - 0.25 | Weak | Not suitable for predictions |
| ≤ 0.10 | Very Weak | Indicates random behaviour |
A Wave Rides NammaMetro

📘 Notes
This visualisation shows a striking inverse relationship between commuter and casual users thus reinforcing a key finding about the dual nature of the metro system.
Having the total ridership line (orange) shows how the two user segments combine to create a more stable overall pattern despite their individual volatility.
The visualisation shows data gaps with dashed lines, maintaining data integrity while still allowing for trend analysis.
The Long Weekend and Other Phenomena
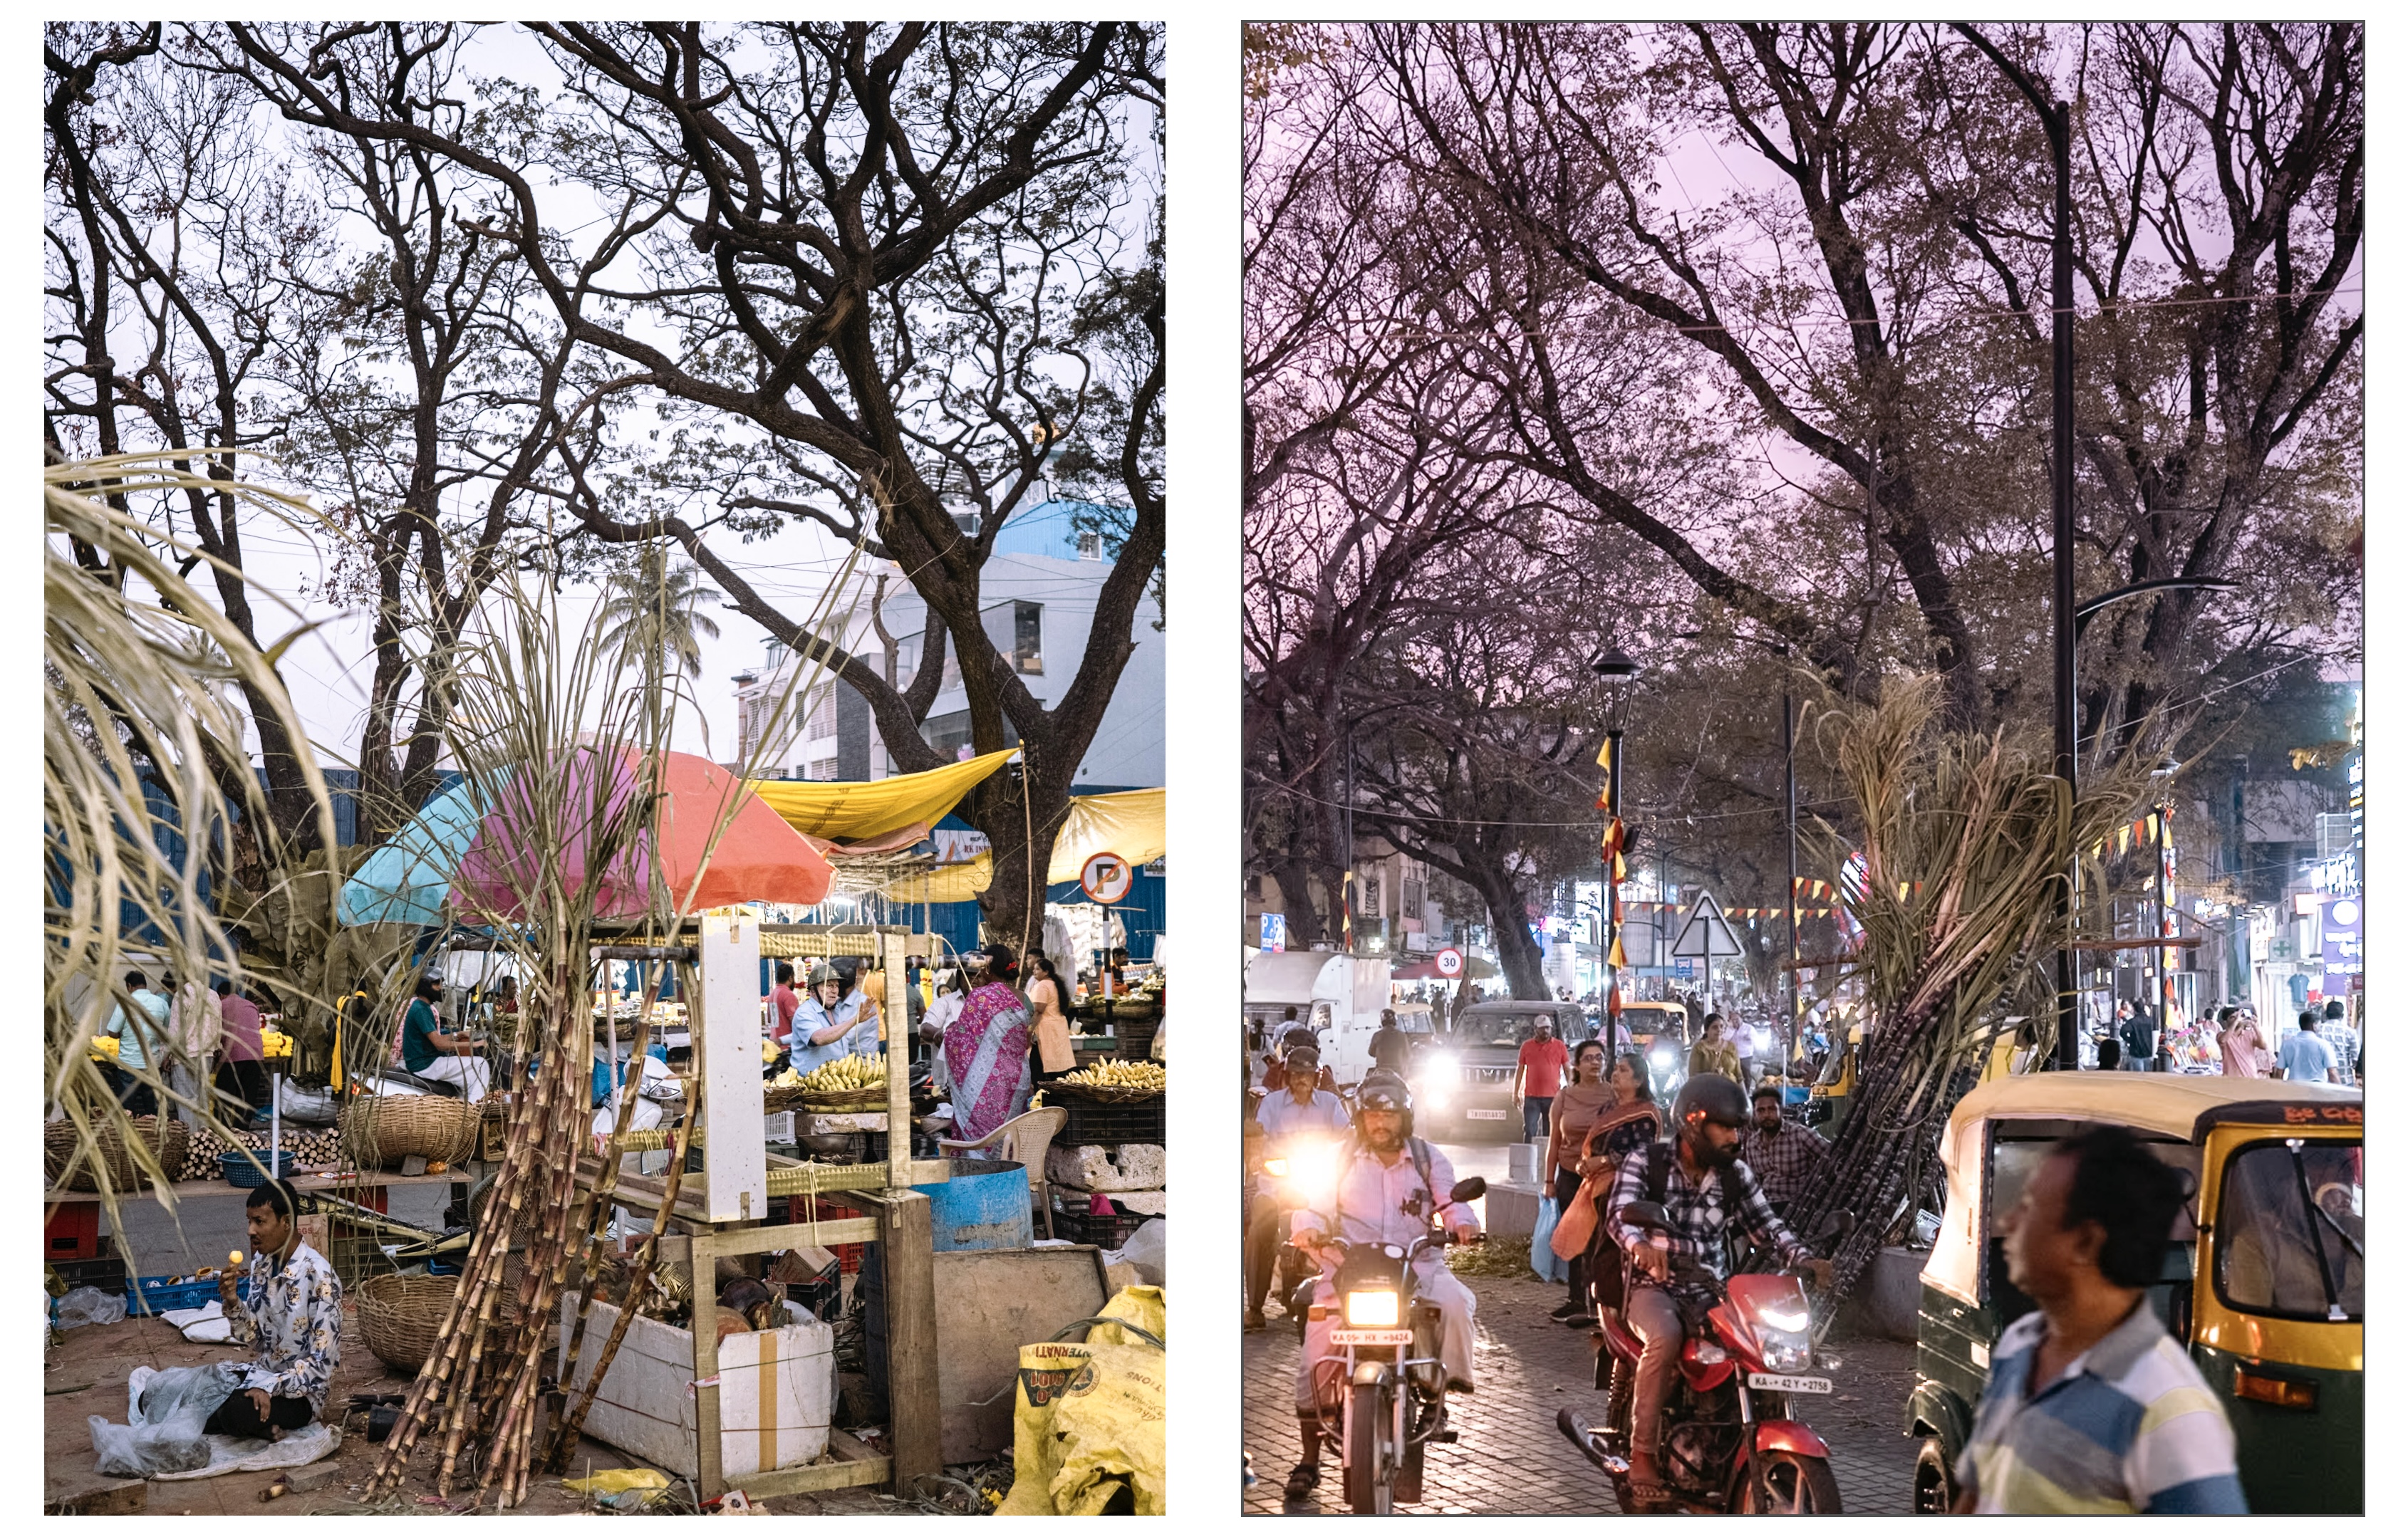
Sankranti Day at Gandhi Bazaar
Ⓜ️ National College 🟢 Green Line
© 2024 Mahesh Shantaram. All Rights Reserved.
Sankranti and Something Else


📘 Notes
Holidays and cultural events have dramatically different impacts on different user segments. The separate but complementary views of Commute and Casual ridership (seen above) expose patterns that would be completely hidden in the aggregate data.
Inverse Relationship: The separate ridership trends for Casual and Commute users confirm a pattern we’ve observed before: when Commuters drop, Casual riders rise. However, there are moments—like Sankranti—when this balance breaks down.
Data Gap Handling: Dashed lines indicate gaps in data collection. Showing these explicitly rather than interpolating them maintains data integrity.
January 14: The Sankranti Effect
The festival caused a sharp drop in Commuters, as many left Bangalore to visit their hometowns.
Unlike regular weekends, Casual ridership did not increase to compensate—suggesting an overall citywide slowdown.
Compounding the disruption, Sankranti fell on a Tuesday, leading to an extended long weekend effect.
👉 Unfortunately, the data gap from Jan 13–17 prevents us from fully seeing this play out. It seems our data collector at NammaMetro also took a long weekend!
Casual Ridership Growth vs. Commuter Stability: R² = 0.105 indicates steady growth in Casual ridership, while the Commuter trend (R² = 0.005) remains largely flat. This hints at broader behavioral shifts—possibly an increase in tourism or recreational metro usage.
Weekend Pattern Clarity: The weekend dips in Commute ridership are more pronounced than the corresponding peaks in Casual ridership, explaining why the total ridership still shows net dips on weekends despite the casual user increase.
🤔 What remains now is to explain the less obvious bump in Commuter traffic on Jan 15-16 and Casual riders on Jan 25.
Ridership Towers – Users and Payments


📘 Notes
These plots visualise the scale of metro operations (serving hundreds of thousands daily) and the relative popularity of different payment options while also highlighting the strong weekly seasonality in urban transit usage.
The asterisks at the top of the chart (indicating imputed data) also highlight how data collection gaps can impact analysis - particularly unfortunate during the Sankranti period when we might have seen interesting cultural patterns.
These visualisations effectively demonstrate how the metro serves dual purposes as both essential infrastructure for commuters and as a convenience for casual/leisure travelers, with the balance shifting dramatically throughout the week.
January 15-16 Anomaly
Hidden beneath a rather normal-looking Thursday ridership, we see the shrinkage in QR+Tokens ("Casual") is compensated by a boost in Smart Card+NCMC ("Commute").
Upon closer observation, we see that QR payments were close to zero, indicating possible system disruption. Consequently, it appears that disappointed users have opted for Smart Cards to get on with their day.
7. Metro Enables the Visitor Economy
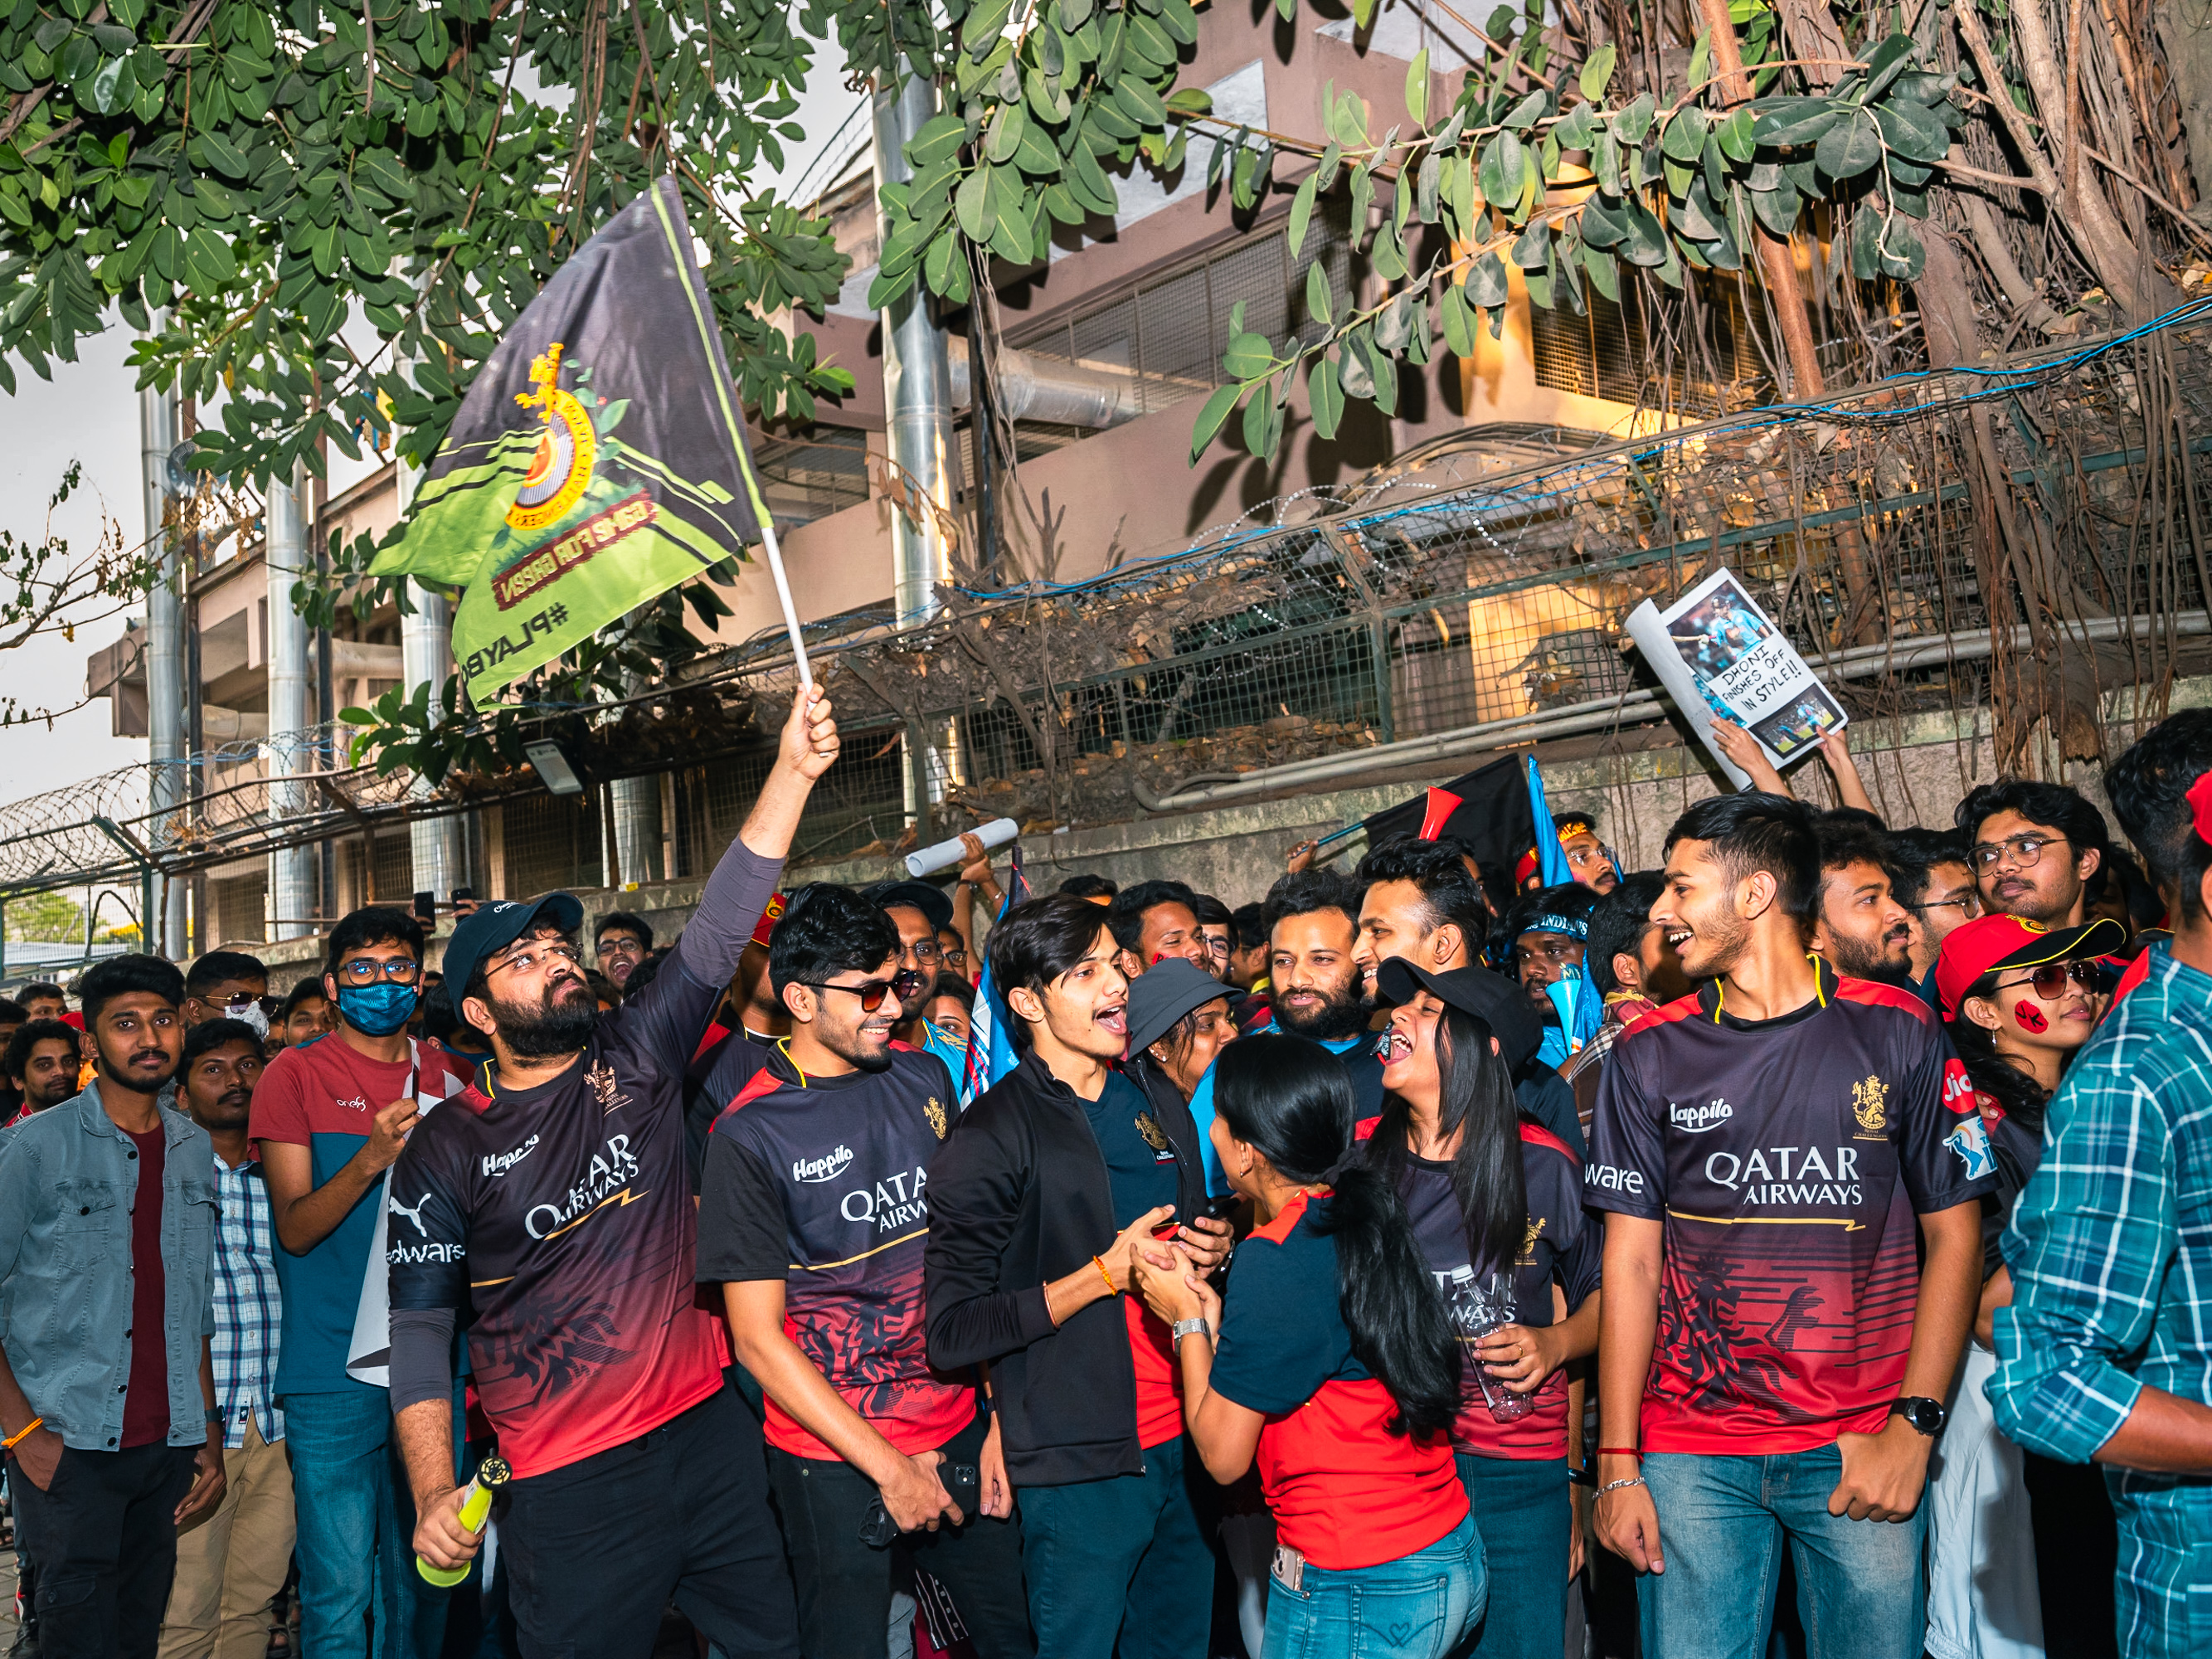
Fans queue up outside Chinnaswamy Stadium before the start of an IPL match
Ⓜ️ Cubbon Park 🟣 Purple Line
© 2023 Mahesh Shantaram. All Rights Reserved.

The Visitor Economy
Bangalore is a rising destination for major sporting and entertainment events, and the city's public and private infrastructure is constantly being upgraded to support these industries. On Jan 25, Karnataka played (and won!) against Punjab in the Ranji Trophy at Bangalore's (metro-accessible) Chinnaswamy Stadium. A couple of weeks later, Ed Sheeran enthralled audiences at the (metro-accessible) NICE Grounds.
The spike in 1/3/5 day passes suggests that the city welcomed many out-of-state sports fans who made a holiday out of their trip. Increased footfall often translates to higher spending in hospitality sectors. This visualization provides evidence for the theory about the economic ripple effects of major events.
Dramatic One-Day Pass Spike: The surge to ~1,750 One-Day Passes (more than double the typical volume) clearly indicates an influx of visitors specifically for the Ranji Trophy final. This surge is a classic marker of event-driven tourism.
Multi-Day Pass Increases: The concurrent rises in Three-Day and Five-Day Passes suggest that a significant portion of visitors planned extended stays in Bangalore beyond just match day - exactly what you'd expect from out-of-state sports tourists making a holiday of their trip.
Sustained Elevated Levels: The elevated pass levels continuing through January 26-27 (though declining) indicate these visitors stayed in the city after the match concluded, likely contributing to weekend hospitality revenue.
Pre-event Arrivals: The different pass types show distinct patterns - One-Day Passes spike dramatically on the event day itself, while Three-Day and Five-Day Passes show a more gradual build-up starting around January 23-24, suggesting pre-event arrivals.
This data quantifies how major events contribute to Bangalore’s visitor economy. The metro pass sales act as a real-time proxy for tourist activity, showing how sports and entertainment events shape urban movement patterns.
Beyond just moving people, the metro facilitates economic flows, reinforcing its role in city planning and development.
Fare Hike of February 2025 – Impact Analysis
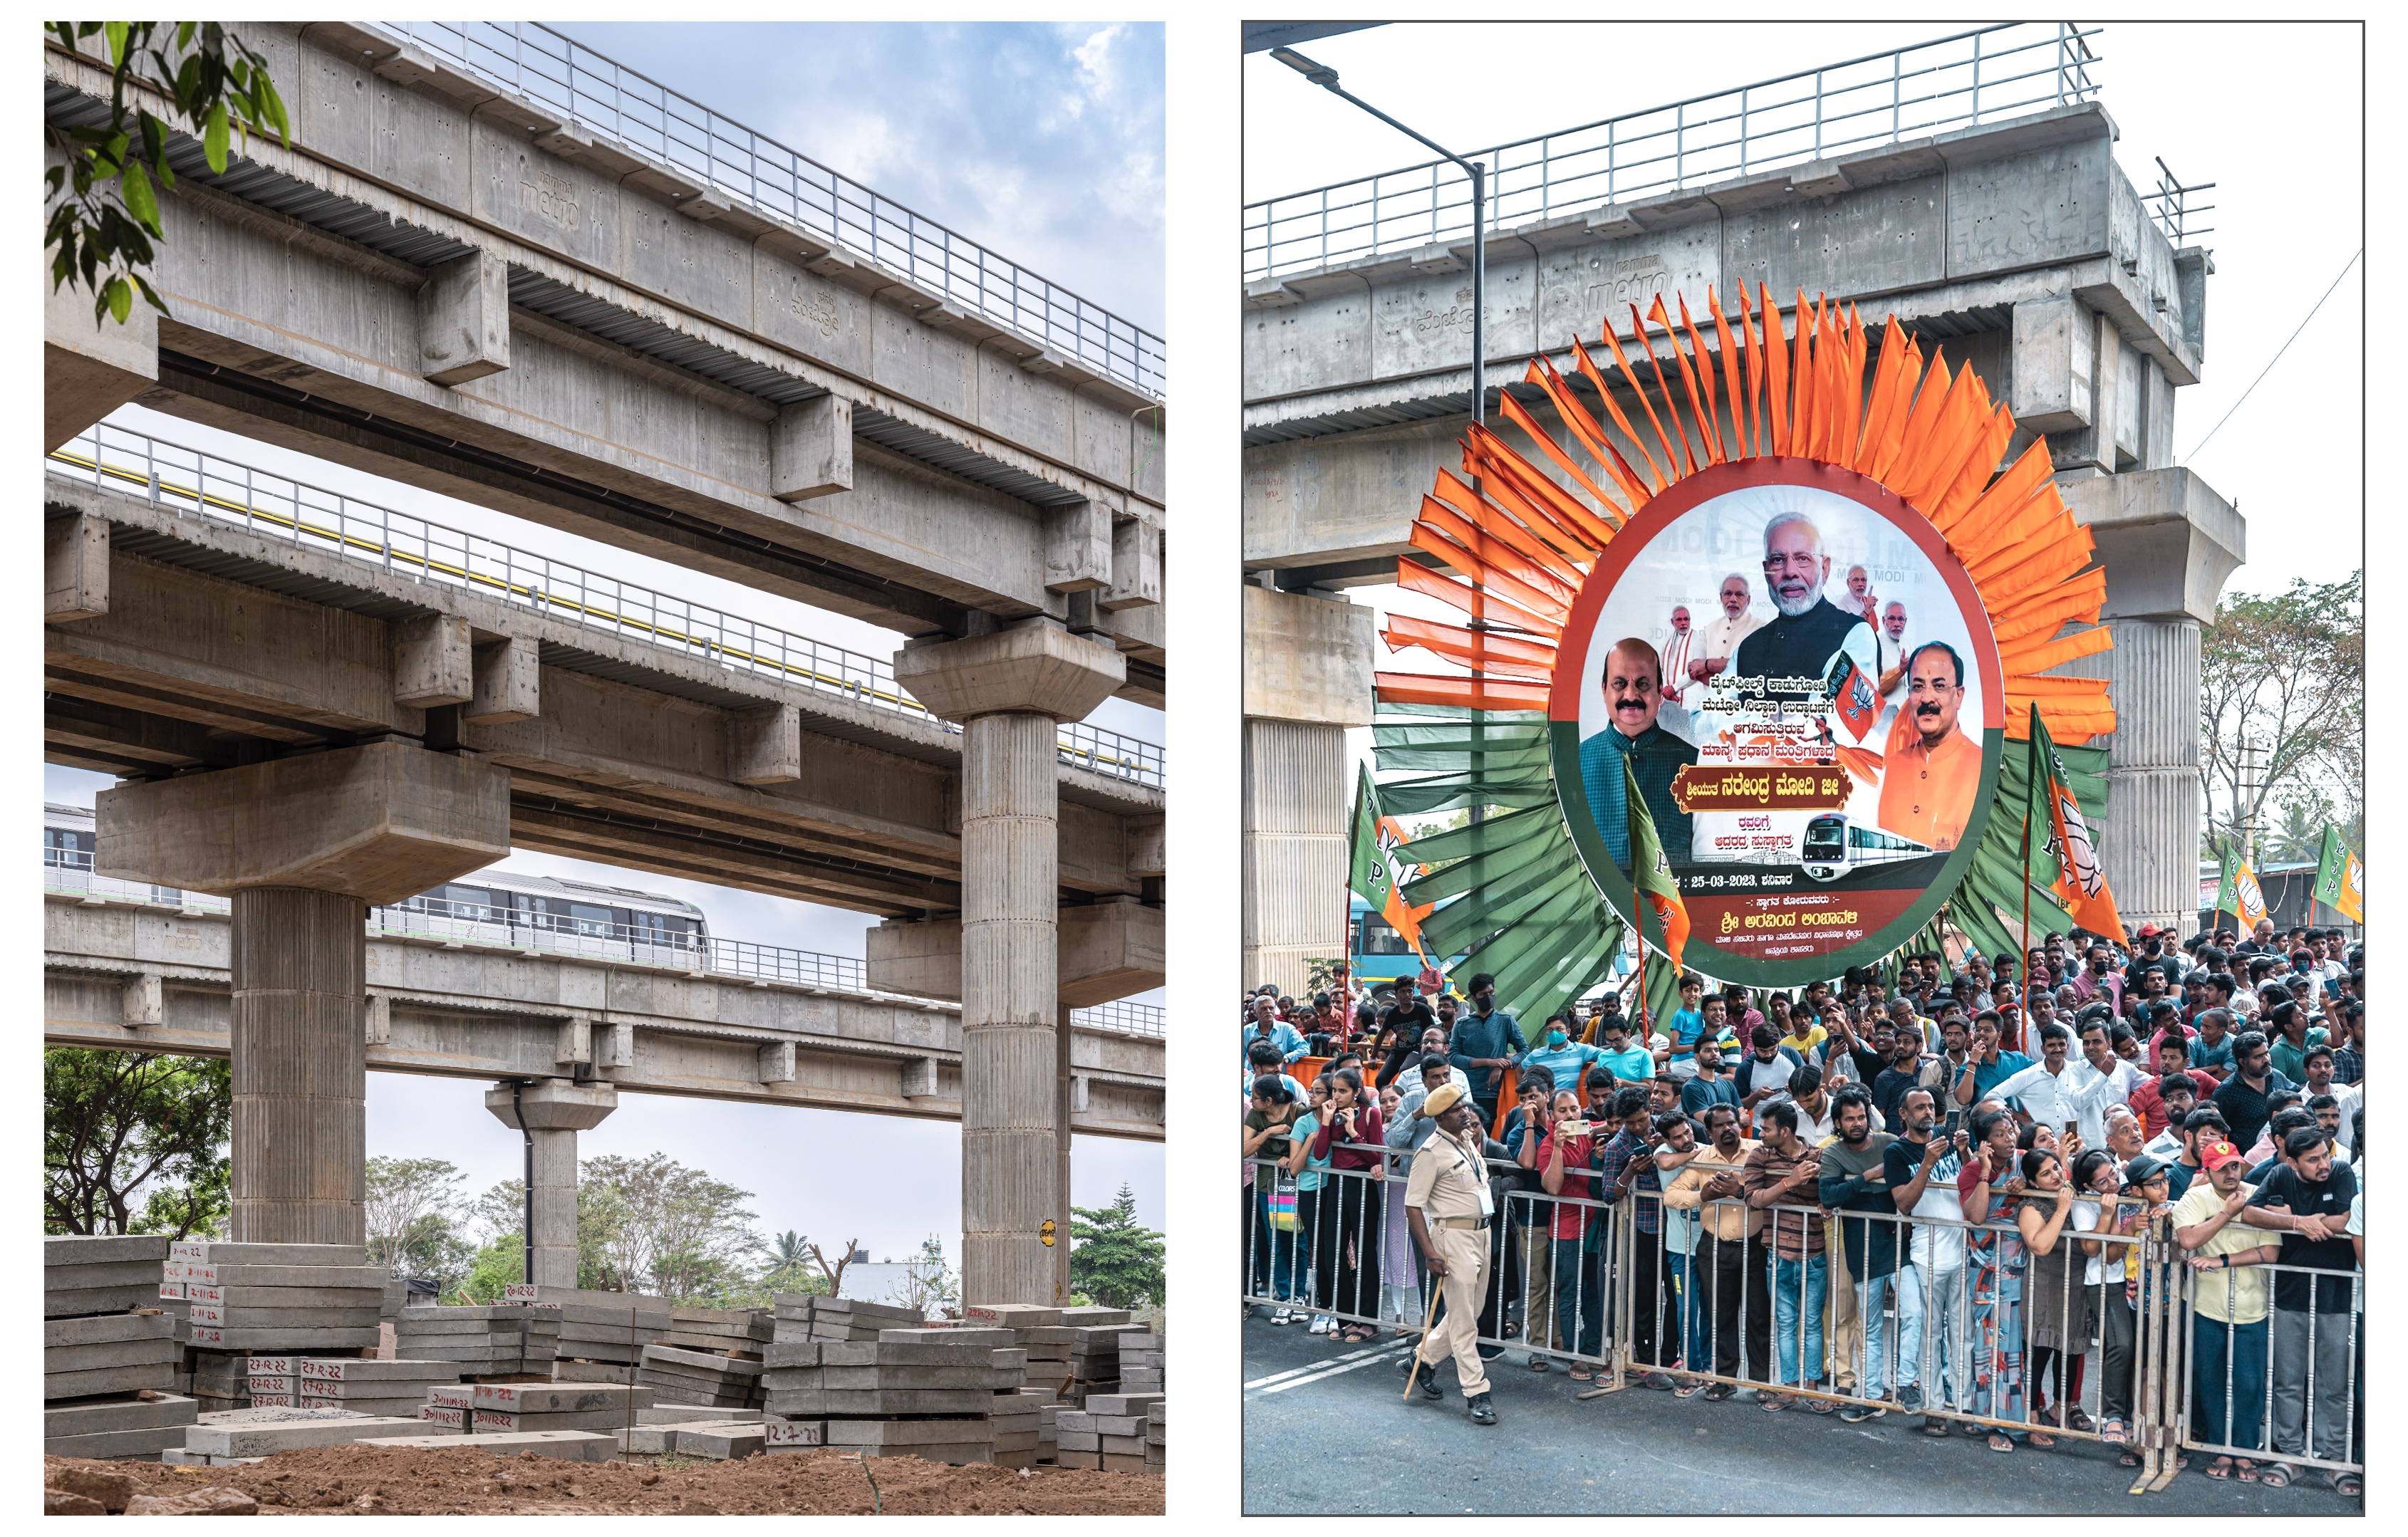
The public gather to catch a glimpse of the Prime Minister who was in the city to inaugurate
the under-construction
Ⓜ️ Whitefield (Kadugodi) Metro Terminus 🟣 Purple Lineand the National Common Mobility Card (NCMC).
© 2023 Mahesh Shantaram. All Rights Reserved.
💡 Did commuters abandon NammaMetro in the week following the fare hike?
Following recommendations of a fare fixation committee, BMRCL revised its fares for the first time since 2017. The new fares took effect on February 9, 2025.
The decision proved to be hugely unpopular with regular metro users, rudely surprising many commuters at the turnstiles on Monday morning, as well as public transportation activists.
The fare increase far exceeded initial projections, and following a public backlash, the maximum fare increase was later capped at 71.43%). Still too high.
The media caught onto the public sentiment and variously reported a drop in daily ridership between 40,000 and 100,000 (13% by one account).
So, did commuters truly abandon the metro in protest, or were other factors at play? Let’s turn to statistical data analysis to separate perception from reality.
Did it hurt?

To assess the immediate impact of the fare hike, we analyzed ridership trends over a six-week window—three weeks before and after the fare revision on February 9, 2025.
The data presents a clear downward trend in daily weekday ridership, with a trendline (R² = 0.740) indicating a strong fit.
After the Hike
✅ Ridership decline is evident
- The trendline suggests a sustained drop rather than a random fluctuation.
📉 Sharp immediate fall
- In the week following the fare hike, ridership plunged significantly, suggesting a strong commuter reaction.
🔢 Quantifiable drop
In the three weeks before Feb 9, the average weekday ridership was 874,000 riders.
In the three weeks after, it fell to 777,000 riders, an 11.1% decrease.
⏳ No immediate recovery
- Ridership does not return to previous levels, suggesting a short-term sustained impact.
But Is the Fare Hike the Only Reason?
While the data confirms a downward trend, could other confounding factors—such as holidays, weather, or seasonal fluctuations—be at play?
As it turns out, Aero India 2025, Bangalore’s bi-annual international air show, took place from Feb 10 to Feb 14—right after the fare hike.
Did Aero India 2025 Play a Role?
✈️ Massive footfall at an event outside Metro reach
On its final day alone, Aero India drew over 100,000 visitors to Yelahanka Airbase.
While official total attendance figures are unavailable, past editions have exceeded a million attendees over five days.
🚆 Why does this matter?
Aero India ran on all weekdays (Feb 10-14), meaning potential Metro users were commuting elsewhere.
The Yelahanka Airbase is not yet connected to the NammaMetro network, making it more likely attendees skipped Metro travel entirely.

Crowds watch the Sukhoi SU-57 in performance at Aero India
Ⓜ️ Yelahanka (Under Construction) 🔵 Blue Line© 2025 Mahesh Shantaram. All Rights Reserved.
Who did it hurt?


👥 Commuters hit hardest
The drop in weekday ridership was primarily driven by daily commuters who reduced their Metro usage more significantly than casual riders.
Casual ridership showed some resilience, likely due to weekend trips and one-off events.
💳 Payment method trends reveal a shift
Smart Card users remain the majority, but the decline in token-based payments suggests infrequent riders reduced trips.
A drop in QR and NCMC-based transactions indicates a potential pullback from occasional users or tourists.
⚠️ Fare structure changes may have influenced behavior
Along with the fare hike, BMRCL introduced new fare rules:
Smart Card & NCMC users get a 5% discount over token fares.
During off-peak hours (before 8am, 12pm-4pm, after 9pm), a 10% discount is applied.
QR payments don’t get any discounts, potentially discouraging casual users.
This may explain why QR-based transactions dropped while Smart Card usage remained stable.
🔍 A closer look at trends
The ridership trends are not solely explained by the fare hike—February saw major events impacting travel patterns.
Aero India 2025 (Feb 10-14) likely pulled potential metro users to an area outside the network, further depressing ridership.
The Ed Sheeran concerts (Feb 9-10) fueled a final pre-hike surge, followed by a steep drop.
Mahashivaratri (Feb 26) introduced further fluctuations, particularly in casual travel.
How badly did it hurt?
To quantify the impact of the fare hike, we conducted statistical hypothesis testing at a 99% confidence level for weekdays and a 95% confidence level for weekends.
At 99.0% Confidence Level:
| Traffic Band | Metric | Pre-Event Mean | Post-Event Mean | Change % | CI Range | Significant? |
|---|---|---|---|---|---|---|
| Weekday | Smart Cards | 457,796 | 414,920 | -9.4% | [-12.2%, -6.6%] | ⬇︎ |
| Weekday | NCMC | 13,338 | 18,590 | +39.4% | [33.0%, 45.7%] | ⬆︎ |
| Weekday | Tokens | 202,258 | 179,534 | -11.2% | [-13.3%, -9.2%] | ⬇︎ |
| Weekday | QR | 186,419 | 161,071 | -13.6% | [-15.8%, -11.4%] | ⬇︎ |
| Weekday | Commute | 471,134 | 433,510 | -8.0% | [-10.8%, -5.2%] | ⬇︎ |
| Weekday | Casual | 389,195 | 341,176 | -12.3% | [-14.0%, -10.7%] | ⬇︎ |
At 95.0% Confidence Level:
| Traffic Band | Metric | Pre-Event Mean | Post-Event Mean | Change % | CI Range | Significant? |
|---|---|---|---|---|---|---|
| Weekend Lite | Smart Cards | 365,396 | 344,836 | -5.6% | [-14.4%, 3.2%] | 🚫 |
| Weekend Lite | NCMC | 10,280 | 15,578 | +51.5% | [39.4%, 63.6%] | ⬆︎ |
| Weekend Lite | Tokens | 223,676 | 198,715 | -11.2% | [-16.8%, -5.5%] | ⬇︎ |
| Weekend Lite | QR | 200,574 | 182,872 | -8.8% | [-15.9%, -1.8%] | ⬇︎ |
| Weekend Lite | Commute | 375,676 | 360,414 | -4.1% | [-12.9%, 4.7%] | 🚫 |
| Weekend Lite | Casual | 424,937 | 382,057 | -10.1% | [-15.3%, -4.9%] | ⬇︎ |
🛜 NCMC Growth Amid Decline
The most striking finding is that NCMC usage actually surged 🚀 39.4% (CI: +33.0% to +45.7%) across both Weekday and Weekend Lite bands while all other payment methods declined.
This dramatic shift that suggests a deliberate migration between payment methods rather than just abandonment of the metro system.
🚇 Smart Card Decline Severe
Despite the 5-10% discount benefit, Smart Card use dropped by 9.4% (CI: -12.2% to -6.6%) 📉
This suggests that while some users may have migrated to NCMC, others did reduce their metro usage.
📱 QR Disadvantaged
QR-based transactions saw the steepest decline at -13.6% (CI: -15.8% to -11.4%) 📉
Commuters (-8.0%) and casual riders (-12.3%) both cut back significantly
This aligns with the new fare structure, which offers discounts only to Smart Card and NCMC users, putting QR-based payments at a disadvantage.
🎢 Weekend riders showed more mixed behavior
Token usage fell by 11.2% (CI: -13.3% to -9.2%) 📉
Casual ridership fell by 10.1%, reinforcing the trend of non-commuter pullback
Smart Card (-5.6%) and Commute (-4.1%) declines were NOT statistically significant 🚫
💡 Rather than a simple “users abandoned the metro” story, this shows a complex adaptation pattern where some users changed behaviour (switched payment methods) while others reduced usage. The statistical significance of these changes confirms they represent real shifts in user behaviour and not just normal variation.

🛜 NCMC Growth Amid Decline
NCMC growth has a strong positive relationship with Smart Cards (0.79) and Commute (0.81), suggesting that many regular commuters adopted NCMC instead of abandoning metro usage entirely.
This indicates a deliberate migration rather than a complete drop in ridership.
🚇 Smart Card Decline Severe
The heatmap shows a strong negative correlation (-0.73) between Smart Cards and Casual ridership, reinforcing that casual users were more likely to abandon Smart Cards entirely rather than switch.
- While some commuters migrated to NCMC, others did reduce their metro usage.
📱 QR Disadvantaged
QR-based transactions saw the steepest decline at -13.6% (CI: -15.8% to -11.4%) 📉.
QR usage shows a very strong negative correlation (-0.88) with NCMC, indicating that QR users heavily migrated to NCMC payments.
🏆 The Bigger Picture: Migration vs. Abandonment
While the statistical data confirms significant shifts in user behaviour, the heatmap reveals that these shifts involved migration between payment methods rather than total abandonment.
NCMC adoption appears to have come largely from former QR users, while QR’s decline aligns with a drop in casual ridership.
Fare policies played a direct role in shaping user behavior, as the introduction of discounts for NCMC and Smart Cards incentivized migration, while the lack of such benefits for QR payments contributed to its decline.
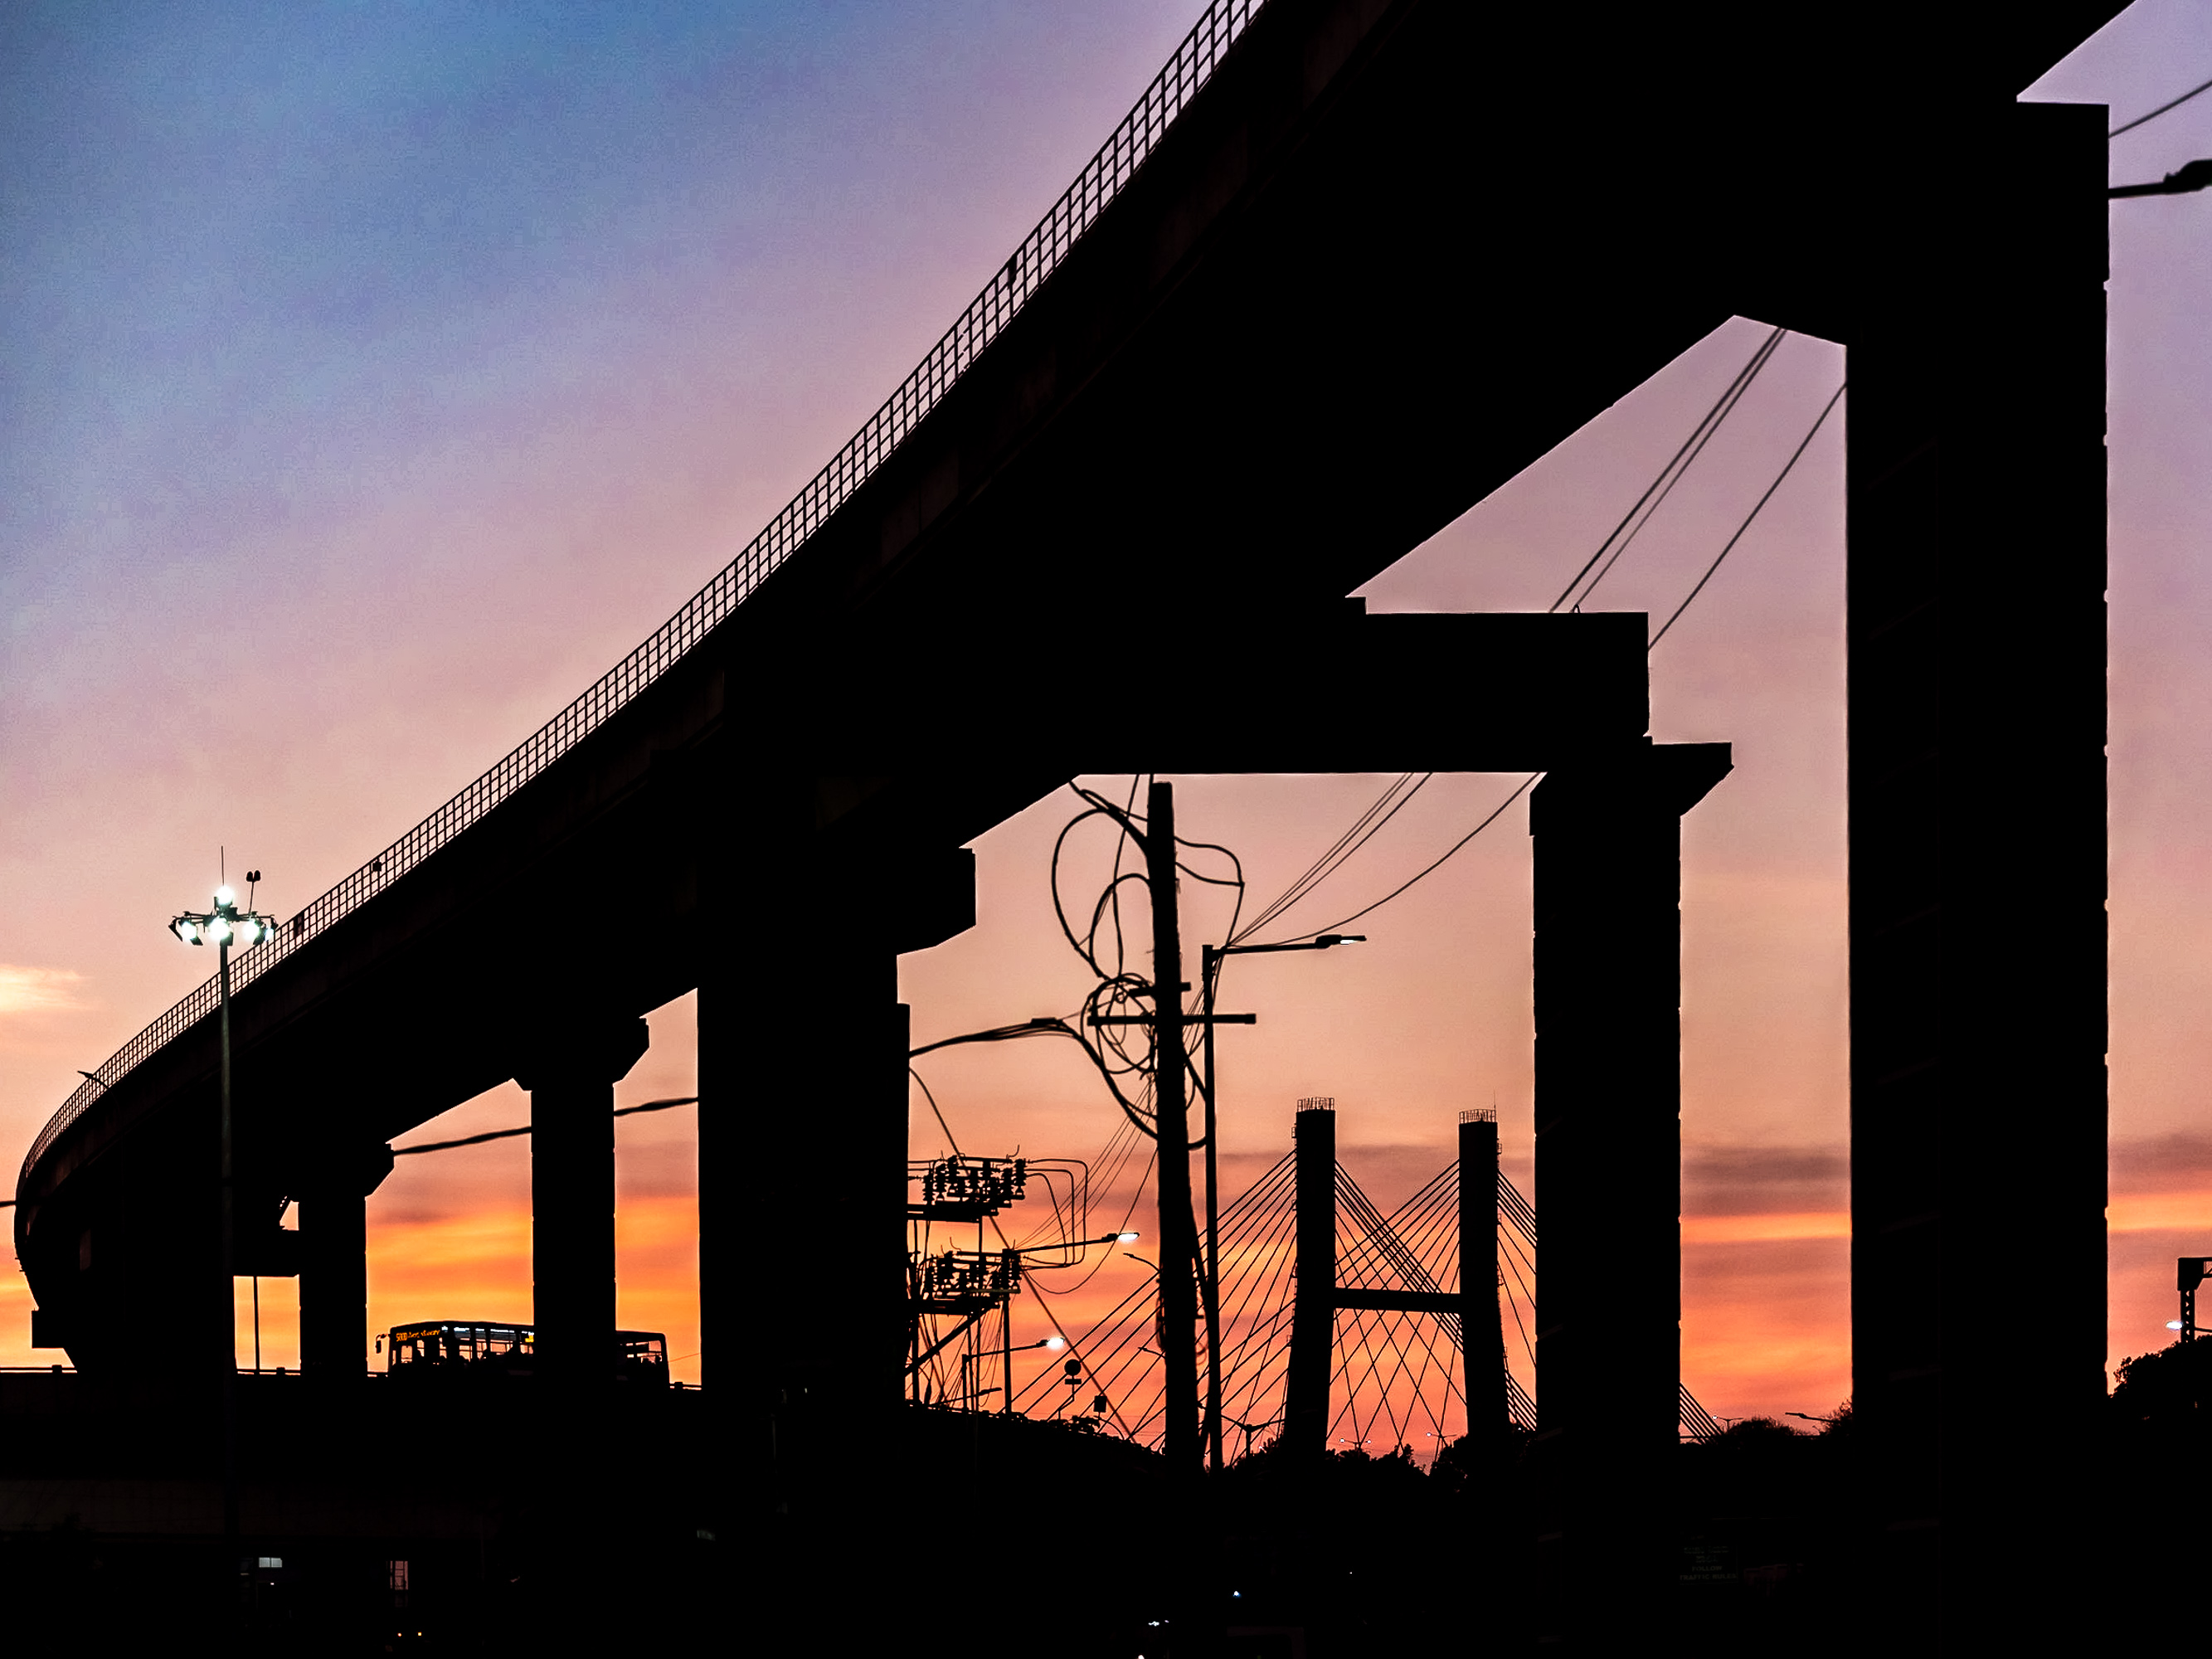
Sunset at KR Pura junction.
Ⓜ️ Krishnarajapura Metro Station 🟣 Purple Line
© 2023 Mahesh Shantaram. All Rights Reserved.
The Conspiracy Theory
The Curious Case of Jan 15-16
Let's start with what is plainly visible in the data.
In any normal week, Smart Cards, QR, and Token payments average 450K, 190K, and 200K respectively. (See Average Daily Ridership by Payment Method)
On Wednesday, January 15, when people were getting back to work after an extended Sankranti holiday, something disrupted the Token system, causing a sharp drop to just 90K transactions–less than half the usual.
The very next day, Thursday, January 16, the data shows that all forms of QR payments (via WhatsApp, Paytm, and even Metro's own QR) collapsed to nearly zero.
Both systems recovered instantly on consecutive days.
Meanwhile, Smart Card transactions shot up drastically, reaching 550K on Jan 15 and an unprecedented 650K on Jan 16—a **+200K single-day spike like never seen before!

👆🏼 Jan 15: Notice the sudden drop in Tokens and sharp rise in Smart Cards.
👇🏼 Jan 16: A collapse in QR payments is accompanied by an astronomical surge in Smart Cards.

Payment Disruptions: Examining the Patterns
Before drawing conclusions, let’s lay out the key observations and assumptions:
Highly Unusual Sequence of Events
A breakdown in the Token system on January 15, immediately followed by a QR payment failure on January 16, is an unusual sequence of events.
Both disruptions resolved fully and immediately after just one day, which is not typical of independent technical failures, where we’d expect staggered recovery times.
The likelihood of two unrelated failures occurring on consecutive days—and then correcting themselves just as quickly—warrants closer scrutiny.
The Smart Card Surge
On January 15-16, Smart Card transactions spiked by over 200,000 in a single day—an extraordinary increase that cannot be explained by organic growth alone.
Interestingly, despite the disruption in one payment system each day, total ridership did not decline significantly. This suggests one payment method effectively compensated for the other, allowing passengers to continue their journeys.
More strikingly, the ability to instantly supply so many Smart Cards across multiple stations suggests prior preparation. Managing an inventory of this scale—particularly for a single-day spike—requires significant logistical planning.
Expected Commuter Behaviour
When faced with a QR payment failure, commuters would likely default to purchasing Tokens at the counter rather than opting for a Smart Card, which involves a minimum lock-in of ₹50 (soon to be raised to ₹90 with the impending fare hike).
If even half of the 200,000 additional Smart Card transactions recorded on January 16 represented new purchases, BMRCL’s ability to distribute and activate so many cards in a single day is impressive and raises questions about whether such a shift was anticipated.
The Fare Hike Connection
The Fare Fixation Committee was scheduled to finalize new metro fares on January 17, with the hike originally expected soon after (though later delayed to February 9).
The timing of the disruptions—just days before this key decision—raises the question: Was this sequence of events purely coincidental? Or did BMRCL orchestrate a controlled disruption to drive Smart Card adoption just before the fare hike?
Motivation & Timing
If BMRCL was aware of an impending fare hike, it would make strategic sense to encourage more commuters to transition to Smart Cards before the announcement.
The opaque communication surrounding the fare hike further supports the possibility of a calculated approach to minimize backlash. At the very least, the data presents a compelling case for closer examination.
Putting the Hypothesis to the Test
To confirm whether these changes were natural variations or an engineered shift, we can put our hypothesis to a statistically rigorous test.
| Hypothesis | Description |
|---|---|
| H₀ | There is no significant difference in the mean transaction volume before and after Jan 14 for the given payment method. Any observed difference is due to random variation. |
| H₁ | There is a significant difference in the mean transaction volume before and after Jan 14. Any observed difference indicates a systematic shift in commuter behavior. |
Confidence Level: 99.9% (α = 0.001)
At 99.9% Confidence Level:
| Traffic Band | Metric | Pre-Event Mean | Post-Event Mean | Change % | CI Range | Significant? |
|---|---|---|---|---|---|---|
| Weekday | Smart Cards | 439,304 | 481,799 | +9.7% | [1.0%, 18.4%] | ⬆︎ |
| Weekday | Tokens | 212,353 | 189,570 | -10.7% | [-19.6%, -1.9%] | ⬇︎ |
| Weekday | QR | 184,206 | 181,343 | -1.6% | [-8.1%, 5.0%] | 🚫 |
| Weekday | NCMC | 12,024 | 15,906 | +32.3% | [24.1%, 40.4%] | ⬆︎ |
| Weekend Lite | Smart Cards | 379,006 | 378,926 | -0.0% | [-14.3%, 14.3%] | 🚫 |
| Weekend Lite | Tokens | 223,547 | 225,160 | +0.7% | [-12.8%, 14.2%] | 🚫 |
| Weekend Lite | QR | 195,645 | 225,211 | +15.1% | [1.4%, 28.9%] | ⬆︎ |
| Weekend Lite | NCMC | 9,429 | 13,278 | +40.8% | [20.3%, 61.4%] | ⬆︎ |
Note: As defined earlier in the analysis, Weekday is Monday to Thursday; Weekend Lite is Friday & Saturday.
Key Findings from Pre- and Post-Smart Card Surge
Token usage dropped sharply (-10.7%) exactly when Smart Cards surged (+9.7%).
This isn’t just a random fluctuation—it indicates a systematic shift in commuter behavior.
Interestingly, QR payments show a significant uptick (+15.1%) only during Weekend Lite periods, while NCMC transactions saw strong growth across the board.
The Unanswered Questions 🤔
Was this a deliberate nudge to increase Smart Card adoption?
If so, was it pre-planned or just an opportunistic move in response to an actual disruption?
Was the fare hike timing connected to this sudden migration push?
One thing is proven: This wasn’t just a normal glitch. 💣
NammaMetro is an immovable property of the citizens in an ever-changing Bangalore landscape.
© 2021 Mahesh Shantaram. All Rights Reserved.