SoLExS Solar Flare Explorer
Study solar flares and other phenomena using data from ISRO's Aditya-L1 space observatory.
🌞 0: Introduction
Aditya-L1 is a solar observatory positioned 1.5 million kilometers from Earth at a place called the Lagrangian point L1, providing a continuous view of the Sun.
SoLEXS is a spectrometer aboard Aditya-L1 that monitors X-ray emissions from the Sun, every second. This data is valuable for studying solar flares, which are bursts of energy released by the Sun.
🚀 ADITYA_L1_EPOCH_UNIX = 1693630800
🚀 ADITYA_L1_EPOCH_UTC = 2023-09-02T06:20:00 UTC
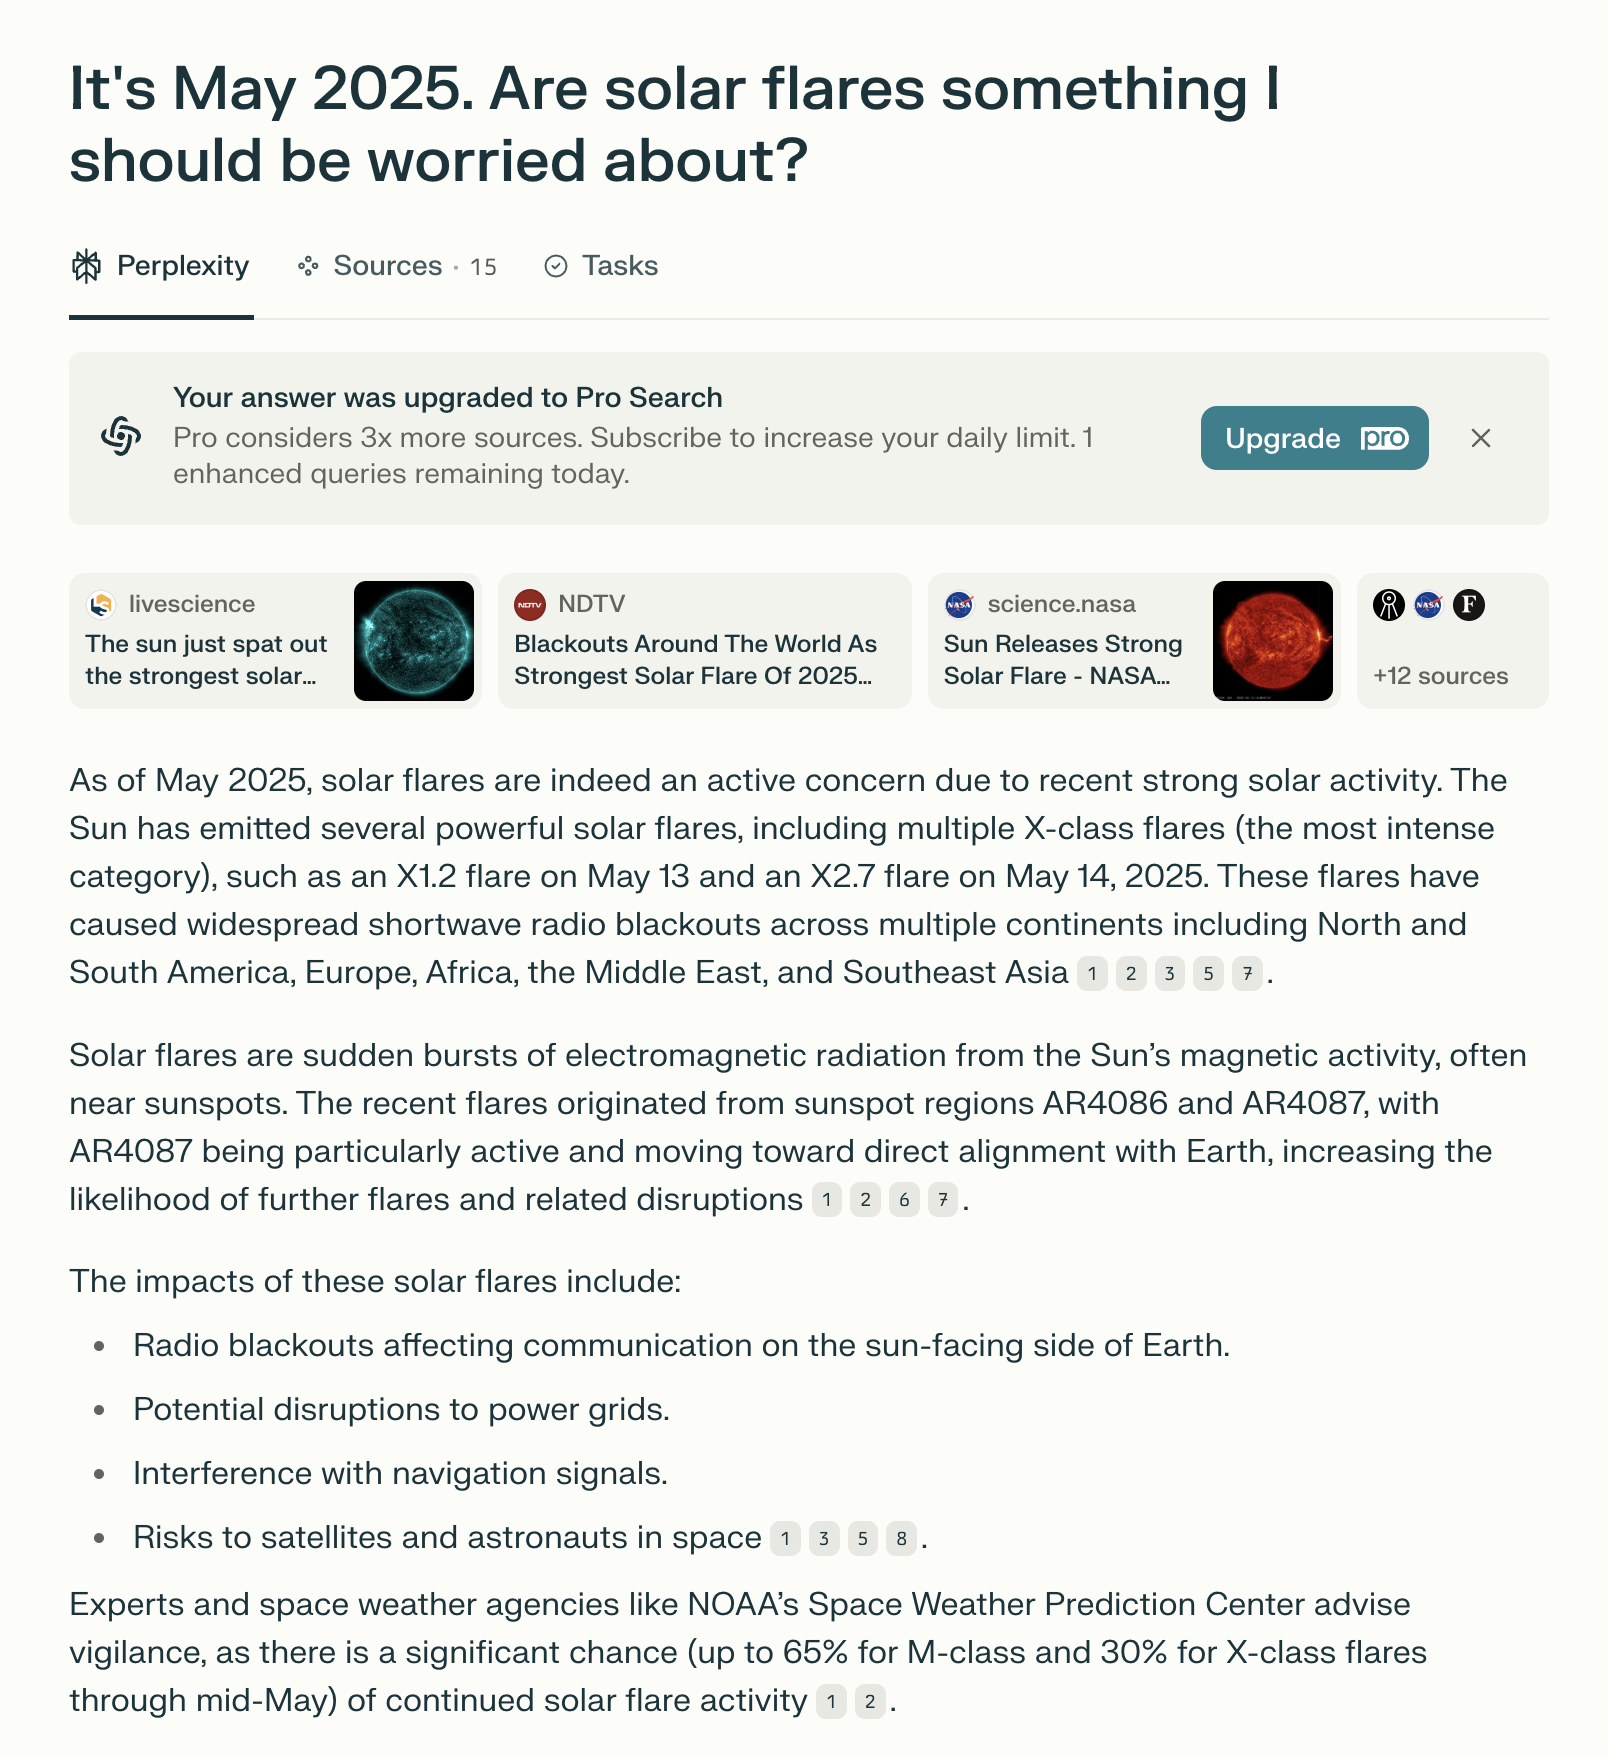
Source: www.perplexity.ai/search/it-s-may-2025-are-solar-flares...
🌞 1: Set up the environment
This cell imports necessary libraries for data handling, plotting, and interactive features. It sets up the environment for reading solar data and creating visualizations.
pandasfor data manipulation and analysis.matplotlib.pyplotfor creating plots and figures.astropy.io.fitsto read FITS-format files containing your lightcurve data.astropy.time.Timefor converting Unix timestamps into human-readable dates/times.gzipandzipfilefor handling compressed files.tqdmandipywidgetsfor visualization and interactive widgets.ipydatetimefor interactive date/time selection.
🌞 2: Take a closer look at the .lc LightCurve file
This cell demonstrates how to inspect a sample lightcurve file, showing its structure and header information to help understand the data format before processing.
Most recent data file: AL1_SLX_L1_20251003_v1.0.zip
| No. | Name | Ver | Type | Cards | Dimensions | Format |
|---|---|---|---|---|---|---|
| 0 | PRIMARY | 1 | PrimaryHDU | 15 | ||
| 1 | RATE | 1 | BinTableHDU | 39 | 86400R x 2C | [D, D] |
Primary HDU Header
| Keyword | Value | Comment |
|---|---|---|
| SIMPLE | True | conforms to FITS standard |
| BITPIX | 8 | array data type |
| NAXIS | 0 | number of array dimensions |
| EXTEND | True | |
| MISSION | ADITYA-L1 | Name of mission/satellite |
| TELESCOP | AL1 | Name of mission/satellite |
| INSTRUME | SoLEXS | Name of Instrument/detector |
| ORIGIN | SoLEXSPOC | Source of FITS file |
| CREATOR | solexs_pipeline-1.3 | Creator of file |
| FILENAME | AL1_SOLEXS_20251003_SDD2_L1.lc | Name of file |
| CONTENT | LIGHT CURVE | File content |
| DATE | 2025-10-05 | Creation Date |
| OBS_DATE | 20251003 | |
| OBS_ID | N00_0000_000660 | |
| DATASUM | 0 | data unit checksum updated 2025-10-05T15:07:42 |
Table HDU Header
| Keyword | Value | Comment |
|---|---|---|
| XTENSION | BINTABLE | binary table extension |
| BITPIX | 8 | array data type |
| NAXIS | 2 | number of array dimensions |
| NAXIS1 | 16 | length of dimension 1 |
| NAXIS2 | 86400 | length of dimension 2 |
| PCOUNT | 0 | number of group parameters |
| GCOUNT | 1 | number of groups |
| TFIELDS | 2 | number of table fields |
| EXTNAME | RATE | Extension name |
| CONTENT | LIGHT CURVE | File content |
| HDUCLASS | OGIP | format conforms to OGIP standard |
| HDUVERS | 1.1.0 | Version of format (OGIP memo CAL/GEN/92-002a) |
| HDUDOC | OGIP memos CAL/GEN/92-007 | Documents describing the format |
| HDUVERS1 | 1.0.0 | Obsolete - included for backwards compatibility |
| HDUVERS2 | 1.1.0 | Obsolete - included for backwards compatibility |
| HDUCLAS1 | LIGHTCURVE | Extension contains spectral data |
| HDUCLAS2 | TOTAL | |
| HDUCLAS3 | COUNTS | |
| FILTER | SDD2 | Filter used |
| TTYPE1 | TIME | |
| TFORM1 | D | |
| TTYPE2 | COUNTS | |
| TFORM2 | D | |
| CREATOR | solexs_pipeline-1.3 | |
| TSTART | 1759449600.0 | |
| TSTOP | 1759535999.0 | |
| TIMEDEL | 1 | |
| TIMZERO | 0 | |
| MJDREFI | 40587 | |
| MJDREFF | 0 | |
| TIMESYS | UTC | |
| TIMEREF | LOCAL | |
| TIMEUNIT | s | |
| DATE-OBS | 2025-10-03 00:00:00 | |
| DATE-END | 2025-10-03 23:59:59 | |
| TELESCOP | AL1 | |
| INSTRUME | SoLEXS | |
| NUMBAND | 4 | |
| DATASUM | 194828409 | data unit checksum updated 2025-10-05T15:07:42 |
🌞 3: Load the SoLEXS data
This cell contains the load_solexs_data function, which reads and processes solar data from ZIP files, handles caching, and outputs a DataFrame for analysis.
Found 2 paths in SoLEXS_dataset.paths
Found 22 ZIP files in data/solexs_202509
Found 3 ZIP files in data/solexs_202510
Processing 25 ZIP files from 2 paths
Loading FITS data: 0%| | 0/25 [00:00<?, ? files/s]
Built fresh dataset with 2,160,000 rows from 25 files
| DATE | TIME | COUNTS | |
|---|---|---|---|
| 0 | 2025-09-01 | 1756684800 | <NA> |
| 1 | 2025-09-01 | 1756684801 | 41 |
| 2 | 2025-09-01 | 1756684802 | 30 |
| 3 | 2025-09-01 | 1756684803 | 31 |
| 4 | 2025-09-01 | 1756684804 | 33 |
| ... | ... | ... | ... |
| 2159995 | 2025-10-03 | 1759535995 | 34 |
| 2159996 | 2025-10-03 | 1759535996 | 32 |
| 2159997 | 2025-10-03 | 1759535997 | 32 |
| 2159998 | 2025-10-03 | 1759535998 | 36 |
| 2159999 | 2025-10-03 | 1759535999 | 34 |
2160000 rows × 3 columns
| DATE | TIME | |
|---|---|---|
| min | 2025-09-01 | 1756684800 |
| max | 2025-10-03 | 1759535999 |
| count | mean | min | 25% | 50% | 75% | max | std | |
|---|---|---|---|---|---|---|---|---|
| COUNTS | 2013512 | 38 | 0 | 13 | 23 | 38 | 1772 | 64 |
🌞 4: Setup interactive widgets and define plotting functions
This cell creates interactive date/time selectors and parameters, allowing users to customize the analysis range and sensitivity for solar flare detection.
🌞 5. Set control variables and go flare hunting
Date and Time Selection: Allows you to specify the start and end dates/times for the data subset. This focuses the analysis on a particular period, making it easier to examine specific solar events.
Sigma (σ): A threshold for flare detection sensitivity. Higher values detect only stronger flares by requiring a larger deviation from the mean count rate, reducing false positives.
Gap: Defines the minimum time interval (in seconds) between detected flares. It prevents closely spaced fluctuations from being counted as separate flares, ensuring more accurate event identification.
Zoom start and end: Controls the range of the plot for detailed viewing. Set these to focus on a specific subset of the data timeline for in-depth analysis of individual flares.
VBox(children=(HTML(value='<h3>Solar Flare Analysis Parameters</h3>'), HBox(children=(VBox(children=(DatePicke…
🌞 6: Plot light curves and detect solar flares
This cell defines a function to plot light curves and detect solar flares based on user inputs, providing visual insights into the data.
Button(button_style='info', description='Update', icon='refresh', style=ButtonStyle())
Output()
🌞 7: Zoom into the wildest flare
This cell zooms into the largest flare detected in the previous step, providing a detailed view of its characteristics.
Button(button_style='info', description='Update', icon='refresh', style=ButtonStyle())
Output()